The table below lists the options of the executed module.
Option | Value |
---|---|
analyze.sites | yes |
differential.report.sites | yes |
region.types | default |
differential.permutations | 0 |
differential.comparison.columns | 6, 7 |
differential.comparison.columns.all.pairwise | 6, 7 |
columns.pairing | default |
differential.site.test.method | limma |
differential.variability | no |
differential.variability.method | diffVar |
covariate.adjustment.columns | default |
differential.adjustment.sva | no |
differential.adjustment.celltype | no |
differential.enrichment.go | yes |
differential.enrichment.lola | no |
differential.enrichment.lola.dbs | ${LOLACore} |
Differential methylation analysis was conducted on site and region level according to the sample groups specified in the analysis.
The following comparisons were made:
In the following anlyses, p-values on the site level were computed using the limma
method. I.e. hierarchical linear models from the limma package were employed and fitted using an empirical Bayes approach on derived M-values.
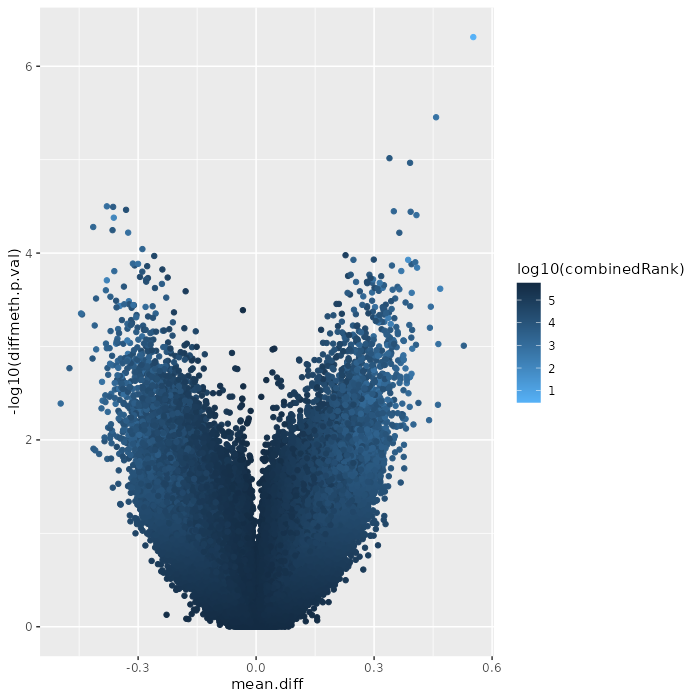
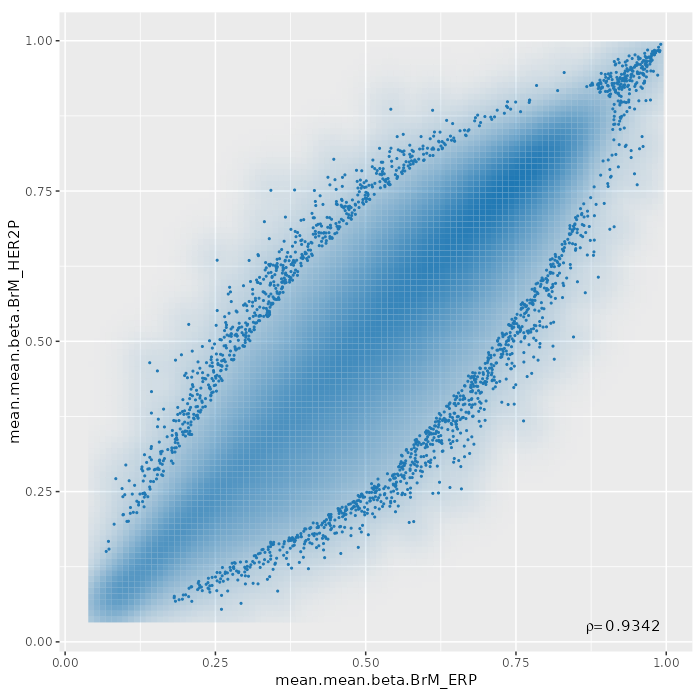
Differential methylation on the site level was computed based on a variety of metrics. Of particular interest for the following plots and analyses are the following quantities for each site: a) the difference in mean methylation levels of the two groups being compared, b) the quotient in mean methylation and c) a statistical test (limma or t-test depending on the settings) assessing whether the methylation values in the two groups originate from distinct distributions. Additionally each site was assigned a rank based on each of these three criteria. A combined rank is computed as the maximum (i.e. worst) rank among the three ranks. The smaller the combined rank for a site, the more evidence for differential methylation it exhibits. This section includes scatterplots of the site group means as well as volcano plots of each pairwise comparison colored according to the combined ranks or p-values of a given site.
The following rank cutfoffs have been automatically selected for the analysis of differentially methylated sites:
Rank Cutoff | |
BrM_ERP vs. BrM_HER2P (based on Tiss_Subprim) | 45 |
BrM_ERP vs. BrM_TNBC (based on Tiss_Subprim) | 73153 |
BrM_ERP vs. Bx_ERP (based on Tiss_Subprim) | 0 |
BrM_ERP vs. Bx_HER2P (based on Tiss_Subprim) | 201 |
BrM_ERP vs. Bx_TNBC (based on Tiss_Subprim) | 76661 |
BrM_HER2P vs. BrM_TNBC (based on Tiss_Subprim) | 81041 |
BrM_HER2P vs. Bx_ERP (based on Tiss_Subprim) | 95461 |
BrM_HER2P vs. Bx_HER2P (based on Tiss_Subprim) | 87803 |
BrM_HER2P vs. Bx_TNBC (based on Tiss_Subprim) | 79388 |
BrM_TNBC vs. Bx_ERP (based on Tiss_Subprim) | 71052 |
BrM_TNBC vs. Bx_HER2P (based on Tiss_Subprim) | 75153 |
BrM_TNBC vs. Bx_TNBC (based on Tiss_Subprim) | 56404 |
Bx_ERP vs. Bx_HER2P (based on Tiss_Subprim) | 4 |
Bx_ERP vs. Bx_TNBC (based on Tiss_Subprim) | 67795 |
Bx_HER2P vs. Bx_TNBC (based on Tiss_Subprim) | 61717 |
NT vs. YT (based on NT) | 97803 |
comparison | |
differential methylation measure |
Scatterplot for differential methylation (sites). If the selected criterion is not rankGradient
:
The transparency corresponds to point density. If the number of points exceeds 2e+06 then the number of points for density estimation is reduced to that number by random sampling.The1% of the points in the sparsest populated plot regions are drawn explicitly (up to a maximum of 10000 points).Additionally, the colored points represent differentially methylated sites (according to the selected criterion).
If the selected criterion is rankGradient
: median combined ranks accross hexagonal bins are shown
as a gradient according to the color legend.
comparison | |
difference metric | |
significance metric |
Volcano plot for differential methylation quantified by various metrics. Color scale according to combined ranking.
A tabular overview of measures for differential methylation on the site level for the individual comparisons are provided in this section. Below, a brief explanation of the different columns can be found:
The tables for the individual comparisons can be found here:
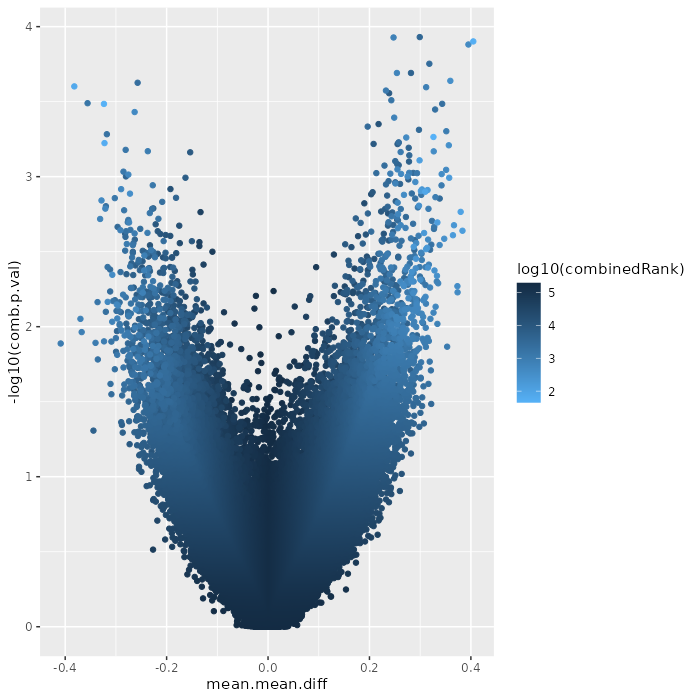
Differential methylation on the region level was computed based on a variety of metrics. Of particular interest for the following plots and analyses are the following quantities for each region: the mean difference in means across all sites in a region of the two groups being compared and the mean of quotients in mean methylation as well as a combined p-value calculated from all site p-values in the region [1]. Additionally each region was assigned a rank based on each of these three criteria. A combined rank is computed as the maximum (i.e. worst) value among the three ranks. The smaller the combined rank for a region, the more evidence for differential methylation it exhibits. Regions were defined based on the region types specified in the analysis. This section includes scatterplots of the region group means as well as volcano plots of each pairwise comparison colored according to the combined rank of a given region.
The following rank cutfoffs have been automatically selected for the analysis of differentially methylated regions:
tiling | genes | promoters | cpgislands | |
BrM_ERP vs. BrM_HER2P (based on Tiss_Subprim) | 0 | 10 | 40 | 0 |
BrM_ERP vs. BrM_TNBC (based on Tiss_Subprim) | 6873 | 19 | 305 | 355 |
BrM_ERP vs. Bx_ERP (based on Tiss_Subprim) | 46 | 11 | 0 | 12 |
BrM_ERP vs. Bx_HER2P (based on Tiss_Subprim) | 6 | 0 | 0 | 1 |
BrM_ERP vs. Bx_TNBC (based on Tiss_Subprim) | 77 | 0 | 60 | 177 |
BrM_HER2P vs. BrM_TNBC (based on Tiss_Subprim) | 10318 | 1021 | 1185 | 1329 |
BrM_HER2P vs. Bx_ERP (based on Tiss_Subprim) | 1958 | 45 | 13 | 0 |
BrM_HER2P vs. Bx_HER2P (based on Tiss_Subprim) | 155 | 0 | 0 | 0 |
BrM_HER2P vs. Bx_TNBC (based on Tiss_Subprim) | 5120 | 343 | 2972 | 1537 |
BrM_TNBC vs. Bx_ERP (based on Tiss_Subprim) | 8917 | 220 | 1549 | 1316 |
BrM_TNBC vs. Bx_HER2P (based on Tiss_Subprim) | 5505 | 1475 | 1249 | 2321 |
BrM_TNBC vs. Bx_TNBC (based on Tiss_Subprim) | 94 | 0 | 71 | 39 |
Bx_ERP vs. Bx_HER2P (based on Tiss_Subprim) | 93 | 0 | 25 | 2 |
Bx_ERP vs. Bx_TNBC (based on Tiss_Subprim) | 4104 | 9 | 3 | 70 |
Bx_HER2P vs. Bx_TNBC (based on Tiss_Subprim) | 3087 | 46 | 1351 | 872 |
NT vs. YT (based on NT) | 6882 | 1380 | 2098 | 2799 |
comparison | |
regions | |
differential methylation measure |
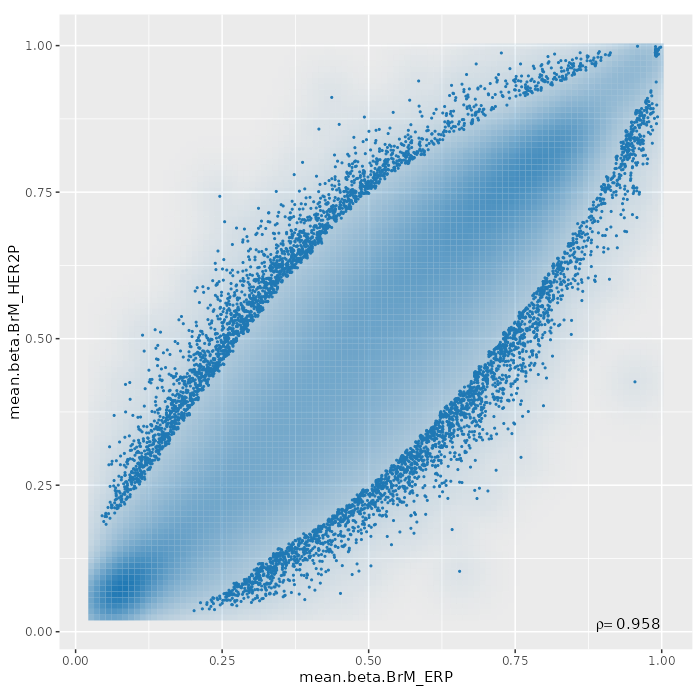
Scatterplot for differential methylation (regions). If the selected criterion is not rankGradient
:
The transparency corresponds to point density. The 1% of the points in the sparsest populated plot regions are drawn explicitly.
Additionally, the colored points represent differentially methylated regions (according to the selected criterion).
If the selected criterion is rankGradient
: median combined ranks accross hexagonal bins are shown
as a gradient according to the color legend.
comparison | |
regions | |
difference metric | |
significance metric |
Volcano plot for differential methylation quantified by various metrics. Color scale according to combined ranking.
A tabular overview of measures for differential methylation on the region level for the individual comparisons are provided in this section.
The tables for the individual comparisons can be found here:
tiling | genes | promoters | cpgislands | |
BrM_ERP vs. BrM_HER2P (based on Tiss_Subprim) | csv | csv | csv | csv |
BrM_ERP vs. BrM_TNBC (based on Tiss_Subprim) | csv | csv | csv | csv |
BrM_ERP vs. Bx_ERP (based on Tiss_Subprim) | csv | csv | csv | csv |
BrM_ERP vs. Bx_HER2P (based on Tiss_Subprim) | csv | csv | csv | csv |
BrM_ERP vs. Bx_TNBC (based on Tiss_Subprim) | csv | csv | csv | csv |
BrM_HER2P vs. BrM_TNBC (based on Tiss_Subprim) | csv | csv | csv | csv |
BrM_HER2P vs. Bx_ERP (based on Tiss_Subprim) | csv | csv | csv | csv |
BrM_HER2P vs. Bx_HER2P (based on Tiss_Subprim) | csv | csv | csv | csv |
BrM_HER2P vs. Bx_TNBC (based on Tiss_Subprim) | csv | csv | csv | csv |
BrM_TNBC vs. Bx_ERP (based on Tiss_Subprim) | csv | csv | csv | csv |
BrM_TNBC vs. Bx_HER2P (based on Tiss_Subprim) | csv | csv | csv | csv |
BrM_TNBC vs. Bx_TNBC (based on Tiss_Subprim) | csv | csv | csv | csv |
Bx_ERP vs. Bx_HER2P (based on Tiss_Subprim) | csv | csv | csv | csv |
Bx_ERP vs. Bx_TNBC (based on Tiss_Subprim) | csv | csv | csv | csv |
Bx_HER2P vs. Bx_TNBC (based on Tiss_Subprim) | csv | csv | csv | csv |
NT vs. YT (based on NT) | csv | csv | csv | csv |
GO Enrichment Analysis was conducted using a hypergeometric test that addresses the hierarchical structure of the ontology (see [2] for details). The wordclouds and tables below contain significant GO terms according to these tests.
comparison | |
Hypermethylation/hypomethylation | |
ontology | |
regions | |
differential methylation measure |
Wordclouds for GO enrichment terms.
comparison | |
Hypermethylation/hypomethylation | |
ontology | |
regions | |
differential methylation measure |
GOMFID | Pvalue | OddsRatio | ExpCount | Count | Size | Term |
GO:0050911 | 0 | 47.5422 | 0.2784 | 8 | 215 | detection of chemical stimulus involved in sensory perception of smell |
GO:0009593 | 0 | 35.1144 | 0.3716 | 8 | 287 | detection of chemical stimulus |
GO:0007606 | 0 | 33.8781 | 0.3845 | 8 | 297 | sensory perception of chemical stimulus |
GO:0050906 | 0 | 32.0686 | 0.4052 | 8 | 313 | detection of stimulus involved in sensory perception |
GO:0007186 | 0 | 9.7041 | 1.261 | 8 | 974 | G protein-coupled receptor signaling pathway |
GO:0050877 | 1e-04 | 7.6163 | 1.5782 | 8 | 1219 | nervous system process |
GO:0044335 | 0.0026 | 809.9 | 0.0026 | 1 | 2 | canonical Wnt signaling pathway involved in neural crest cell differentiation |
GO:0009822 | 0.0039 | 404.925 | 0.0039 | 1 | 3 | alkaloid catabolic process |
GO:0036378 | 0.0052 | 269.9333 | 0.0052 | 1 | 4 | calcitriol biosynthetic process from calciol |
GO:0042369 | 0.0052 | 269.9333 | 0.0052 | 1 | 4 | vitamin D catabolic process |
GO:0044107 | 0.0052 | 269.9333 | 0.0052 | 1 | 4 | cellular alcohol metabolic process |
GO:0044278 | 0.0052 | 269.9333 | 0.0052 | 1 | 4 | cell wall disruption in another organism |
GO:0061317 | 0.0065 | 202.4375 | 0.0065 | 1 | 5 | canonical Wnt signaling pathway involved in cardiac muscle cell fate commitment |
GO:0035195 | 0.0068 | 8.8029 | 0.3936 | 3 | 304 | miRNA-mediated gene silencing |
GO:0016441 | 0.0075 | 8.459 | 0.4091 | 3 | 316 | post-transcriptional gene silencing |
GO:0014034 | 0.0077 | 161.94 | 0.0078 | 1 | 6 | neural crest cell fate commitment |
GO:0016098 | 0.0077 | 161.94 | 0.0078 | 1 | 6 | monoterpenoid metabolic process |
GO:0002933 | 0.009 | 134.9417 | 0.0091 | 1 | 7 | lipid hydroxylation |
GO:0045617 | 0.009 | 134.9417 | 0.0091 | 1 | 7 | negative regulation of keratinocyte differentiation |
GO:0046222 | 0.009 | 134.9417 | 0.0091 | 1 | 7 | aflatoxin metabolic process |
GO:0031047 | 0.009 | 7.8925 | 0.4376 | 3 | 338 | gene silencing by RNA |
GO:0055007 | 0.0093 | 15.2565 | 0.1463 | 2 | 113 | cardiac muscle cell differentiation |
GOMFID | Pvalue | OddsRatio | ExpCount | Count | Size | Term |
GO:0006335 | 0 | 2020.5 | 0.0947 | 24 | 32 | DNA replication-dependent chromatin assembly |
GO:0006334 | 0 | 243.8485 | 0.3078 | 26 | 104 | nucleosome assembly |
GO:0071824 | 0 | 102.6897 | 0.6215 | 26 | 210 | protein-DNA complex subunit organization |
GO:0032200 | 0 | 121.5152 | 0.4617 | 24 | 156 | telomere organization |
GO:0006338 | 0 | 89.3981 | 0.7014 | 26 | 237 | chromatin remodeling |
GO:0045653 | 0 | 1664.3529 | 0.0533 | 14 | 18 | negative regulation of megakaryocyte differentiation |
GO:0006336 | 0 | 369.5359 | 0.0947 | 14 | 32 | DNA replication-independent chromatin assembly |
GO:0006352 | 0 | 60.1251 | 0.367 | 14 | 124 | DNA-templated transcription, initiation |
GO:0065003 | 0 | 13.7923 | 4.1608 | 27 | 1406 | protein-containing complex assembly |
GO:0045637 | 0 | 35.7788 | 0.5859 | 14 | 198 | regulation of myeloid cell differentiation |
GO:0040029 | 0 | 34.3368 | 0.3936 | 10 | 133 | regulation of gene expression, epigenetic |
GO:0045596 | 0 | 11.5176 | 1.8614 | 15 | 629 | negative regulation of cell differentiation |
GO:0044085 | 0 | 6.3643 | 8.7122 | 28 | 2944 | cellular component biogenesis |
GO:0006996 | 0 | 5.8918 | 10.6417 | 30 | 3596 | organelle organization |
GO:0002520 | 0 | 7.7222 | 2.7048 | 15 | 914 | immune system development |
GO:0030097 | 0 | 7.8913 | 2.4148 | 14 | 816 | hemopoiesis |
GO:2000026 | 0 | 5.2884 | 3.8323 | 15 | 1295 | regulation of multicellular organismal development |
GO:0097659 | 0 | 3.7794 | 9.4372 | 23 | 3189 | nucleic acid-templated transcription |
GO:0002682 | 0 | 4.9197 | 3.7376 | 14 | 1263 | regulation of immune system process |
GO:0034654 | 1e-04 | 3.2841 | 10.5411 | 23 | 3562 | nucleobase-containing compound biosynthetic process |
GO:0048513 | 5e-04 | 2.8477 | 9.6562 | 20 | 3263 | animal organ development |
GO:0065007 | 9e-04 | 3.7846 | 33.3603 | 43 | 11273 | biological regulation |
GO:0009059 | 0.0011 | 2.5824 | 12.6392 | 23 | 4271 | macromolecule biosynthetic process |
GO:0016070 | 0.0012 | 2.5603 | 12.7191 | 23 | 4298 | RNA metabolic process |
GO:0010467 | 0.0013 | 3.7979 | 4.9018 | 12 | 2555 | gene expression |
GO:0048485 | 0.0019 | 35.113 | 0.0651 | 2 | 22 | sympathetic nervous system development |
GO:0008152 | 0.0022 | 3.0211 | 31.6942 | 41 | 10710 | metabolic process |
GO:0046483 | 0.0023 | 2.3766 | 15.9714 | 26 | 5397 | heterocycle metabolic process |
GO:0044249 | 0.0027 | 2.3436 | 15.2375 | 25 | 5149 | cellular biosynthetic process |
GO:0097275 | 0.003 | Inf | 0.003 | 1 | 1 | cellular ammonium homeostasis |
GO:0097276 | 0.003 | Inf | 0.003 | 1 | 1 | cellular creatinine homeostasis |
GO:0097277 | 0.003 | Inf | 0.003 | 1 | 1 | cellular urea homeostasis |
GO:2000763 | 0.003 | Inf | 0.003 | 1 | 1 | positive regulation of transcription from RNA polymerase II promoter involved in norepinephrine biosynthetic process |
GO:2000764 | 0.003 | Inf | 0.003 | 1 | 1 | positive regulation of semaphorin-plexin signaling pathway involved in outflow tract morphogenesis |
GO:0007631 | 0.0032 | 11.0481 | 0.2959 | 3 | 100 | feeding behavior |
GO:1901360 | 0.005 | 2.1997 | 16.803 | 26 | 5678 | organic cyclic compound metabolic process |
GO:0002032 | 0.0059 | 344.0638 | 0.0059 | 1 | 2 | desensitization of G protein-coupled receptor signaling pathway by arrestin |
GO:0042412 | 0.0059 | 344.0638 | 0.0059 | 1 | 2 | taurine biosynthetic process |
GO:0061032 | 0.0059 | 344.0638 | 0.0059 | 1 | 2 | visceral serous pericardium development |
GO:0061885 | 0.0059 | 344.0638 | 0.0059 | 1 | 2 | positive regulation of mini excitatory postsynaptic potential |
GO:0090663 | 0.0059 | 344.0638 | 0.0059 | 1 | 2 | galanin-activated signaling pathway |
GO:1903929 | 0.0059 | 344.0638 | 0.0059 | 1 | 2 | primary palate development |
GO:0002025 | 0.0089 | 172.0213 | 0.0089 | 1 | 3 | norepinephrine-epinephrine-mediated vasodilation involved in regulation of systemic arterial blood pressure |
GO:0009822 | 0.0089 | 172.0213 | 0.0089 | 1 | 3 | alkaloid catabolic process |
GO:2001260 | 0.0089 | 172.0213 | 0.0089 | 1 | 3 | regulation of semaphorin-plexin signaling pathway |
GO:0021515 | 0.0096 | 14.6051 | 0.148 | 2 | 50 | cell differentiation in spinal cord |
GOMFID | Pvalue | OddsRatio | ExpCount | Count | Size | Term |
GO:0048252 | 0 | 3601.7778 | 0.002 | 2 | 3 | lauric acid metabolic process |
GO:0043651 | 1e-04 | 224.9028 | 0.0122 | 2 | 18 | linoleic acid metabolic process |
GO:0046456 | 6e-04 | 70.4052 | 0.0359 | 2 | 53 | icosanoid biosynthetic process |
GO:1901625 | 7e-04 | Inf | 7e-04 | 1 | 1 | cellular response to ergosterol |
GO:1905608 | 7e-04 | Inf | 7e-04 | 1 | 1 | positive regulation of presynapse assembly |
GO:0003095 | 0.0014 | 1620.8 | 0.0014 | 1 | 2 | pressure natriuresis |
GO:0031408 | 0.0014 | 1620.8 | 0.0014 | 1 | 2 | oxylipin biosynthetic process |
GO:0015908 | 0.0018 | 38.93 | 0.0637 | 2 | 94 | fatty acid transport |
GO:0036101 | 0.0027 | 540.2 | 0.0027 | 1 | 4 | leukotriene B4 catabolic process |
GO:0002933 | 0.0047 | 270.05 | 0.0047 | 1 | 7 | lipid hydroxylation |
GO:0048680 | 0.0061 | 202.5125 | 0.0061 | 1 | 9 | positive regulation of axon regeneration |
GO:0097267 | 0.0061 | 202.5125 | 0.0061 | 1 | 9 | omega-hydroxylase P450 pathway |
GO:0050911 | 0.0089 | 16.6886 | 0.1458 | 2 | 215 | detection of chemical stimulus involved in sensory perception of smell |
GOMFID | Pvalue | OddsRatio | ExpCount | Count | Size | Term |
GO:0010536 | 0 | 426.1842 | 0.0078 | 2 | 6 | positive regulation of activation of Janus kinase activity |
GO:0046427 | 0.0012 | 44.7673 | 0.0518 | 2 | 40 | positive regulation of receptor signaling pathway via JAK-STAT |
GO:0071622 | 0.0016 | 38.6483 | 0.0596 | 2 | 46 | regulation of granulocyte chemotaxis |
GO:0002573 | 0.0021 | 13.608 | 0.2576 | 3 | 199 | myeloid leukocyte differentiation |
GO:0050918 | 0.0024 | 31.4717 | 0.0725 | 2 | 56 | positive chemotaxis |
GO:0050920 | 0.0024 | 12.876 | 0.2719 | 3 | 210 | regulation of chemotaxis |
GO:0042531 | 0.0027 | 29.294 | 0.0777 | 2 | 60 | positive regulation of tyrosine phosphorylation of STAT protein |
GO:0072503 | 0.0027 | 8.0327 | 0.602 | 4 | 465 | cellular divalent inorganic cation homeostasis |
GO:0045670 | 0.003 | 27.8481 | 0.0816 | 2 | 63 | regulation of osteoclast differentiation |
GO:0035924 | 0.0033 | 26.5378 | 0.0855 | 2 | 66 | cellular response to vascular endothelial growth factor stimulus |
GO:0009822 | 0.0039 | 404.925 | 0.0039 | 1 | 3 | alkaloid catabolic process |
GO:2000503 | 0.0039 | 404.925 | 0.0039 | 1 | 3 | positive regulation of natural killer cell chemotaxis |
GO:0014068 | 0.0045 | 22.331 | 0.101 | 2 | 78 | positive regulation of phosphatidylinositol 3-kinase signaling |
GO:0006875 | 0.005 | 6.7201 | 0.7147 | 4 | 552 | cellular metal ion homeostasis |
GO:0040017 | 0.0051 | 6.6948 | 0.7173 | 4 | 554 | positive regulation of locomotion |
GO:0036378 | 0.0052 | 269.9333 | 0.0052 | 1 | 4 | calcitriol biosynthetic process from calciol |
GO:0042369 | 0.0052 | 269.9333 | 0.0052 | 1 | 4 | vitamin D catabolic process |
GO:0044107 | 0.0052 | 269.9333 | 0.0052 | 1 | 4 | cellular alcohol metabolic process |
GO:2000330 | 0.0052 | 269.9333 | 0.0052 | 1 | 4 | positive regulation of T-helper 17 cell lineage commitment |
GO:0002690 | 0.0056 | 19.9554 | 0.1126 | 2 | 87 | positive regulation of leukocyte chemotaxis |
GO:0060326 | 0.0058 | 9.3064 | 0.3729 | 3 | 288 | cell chemotaxis |
GO:1990869 | 0.0058 | 19.4943 | 0.1152 | 2 | 89 | cellular response to chemokine |
GO:0042102 | 0.0064 | 18.6327 | 0.1204 | 2 | 93 | positive regulation of T cell proliferation |
GO:0009617 | 0.0064 | 6.2359 | 0.7678 | 4 | 593 | response to bacterium |
GO:1904892 | 0.0065 | 18.4291 | 0.1217 | 2 | 94 | regulation of receptor signaling pathway via STAT |
GO:0030593 | 0.0068 | 18.0347 | 0.1243 | 2 | 96 | neutrophil chemotaxis |
GO:0006805 | 0.0069 | 17.8438 | 0.1256 | 2 | 97 | xenobiotic metabolic process |
GO:0001676 | 0.0073 | 17.2943 | 0.1295 | 2 | 100 | long-chain fatty acid metabolic process |
GO:0016098 | 0.0077 | 161.94 | 0.0078 | 1 | 6 | monoterpenoid metabolic process |
GO:0031584 | 0.0077 | 161.94 | 0.0078 | 1 | 6 | activation of phospholipase D activity |
GO:0033634 | 0.0077 | 161.94 | 0.0078 | 1 | 6 | positive regulation of cell-cell adhesion mediated by integrin |
GO:0051142 | 0.0077 | 161.94 | 0.0078 | 1 | 6 | positive regulation of NK T cell proliferation |
GO:0070100 | 0.0077 | 161.94 | 0.0078 | 1 | 6 | negative regulation of chemokine-mediated signaling pathway |
GO:0006873 | 0.0081 | 5.834 | 0.8182 | 4 | 632 | cellular ion homeostasis |
GO:0006955 | 0.0085 | 4.0811 | 1.8799 | 6 | 1452 | immune response |
GO:0050867 | 0.0089 | 7.9409 | 0.435 | 3 | 336 | positive regulation of cell activation |
GO:0002933 | 0.009 | 134.9417 | 0.0091 | 1 | 7 | lipid hydroxylation |
GO:0007597 | 0.009 | 134.9417 | 0.0091 | 1 | 7 | blood coagulation, intrinsic pathway |
GO:0019367 | 0.009 | 134.9417 | 0.0091 | 1 | 7 | fatty acid elongation, saturated fatty acid |
GO:0034625 | 0.009 | 134.9417 | 0.0091 | 1 | 7 | fatty acid elongation, monounsaturated fatty acid |
GO:0034626 | 0.009 | 134.9417 | 0.0091 | 1 | 7 | fatty acid elongation, polyunsaturated fatty acid |
GO:0046222 | 0.009 | 134.9417 | 0.0091 | 1 | 7 | aflatoxin metabolic process |
GO:0006952 | 0.0099 | 3.94 | 1.9408 | 6 | 1499 | defense response |
GOMFID | Pvalue | OddsRatio | ExpCount | Count | Size | Term |
GO:0003002 | 2e-04 | 11.2372 | 0.5466 | 5 | 341 | regionalization |
GO:0048598 | 3e-04 | 8.0046 | 0.9473 | 6 | 591 | embryonic morphogenesis |
GO:0048704 | 4e-04 | 23.3391 | 0.1491 | 3 | 93 | embryonic skeletal system morphogenesis |
GO:0006357 | 5e-04 | 4.3788 | 3.7413 | 11 | 2334 | regulation of transcription by RNA polymerase II |
GO:0048568 | 6e-04 | 8.646 | 0.7037 | 5 | 439 | embryonic organ development |
GO:0021767 | 0.0016 | Inf | 0.0016 | 1 | 1 | mammillary body development |
GO:0042668 | 0.0016 | Inf | 0.0016 | 1 | 1 | auditory receptor cell fate determination |
GO:0045609 | 0.0016 | Inf | 0.0016 | 1 | 1 | positive regulation of inner ear auditory receptor cell differentiation |
GO:0045633 | 0.0016 | Inf | 0.0016 | 1 | 1 | positive regulation of mechanoreceptor differentiation |
GO:0061374 | 0.0016 | Inf | 0.0016 | 1 | 1 | mammillothalamic axonal tract development |
GO:0061381 | 0.0016 | Inf | 0.0016 | 1 | 1 | cell migration in diencephalon |
GO:1901625 | 0.0016 | Inf | 0.0016 | 1 | 1 | cellular response to ergosterol |
GO:0014014 | 0.0019 | 34.5192 | 0.0657 | 2 | 41 | negative regulation of gliogenesis |
GO:0021543 | 0.0021 | 13.1542 | 0.2597 | 3 | 162 | pallium development |
GO:0030900 | 0.0024 | 8.0657 | 0.5787 | 4 | 361 | forebrain development |
GO:0043009 | 0.0027 | 6.0416 | 0.9922 | 5 | 619 | chordate embryonic development |
GO:0021893 | 0.0032 | 647.72 | 0.0032 | 1 | 2 | cerebral cortex GABAergic interneuron fate commitment |
GO:0042667 | 0.0032 | 647.72 | 0.0032 | 1 | 2 | auditory receptor cell fate specification |
GO:0061379 | 0.0032 | 647.72 | 0.0032 | 1 | 2 | inferior colliculus development |
GO:1902871 | 0.0032 | 647.72 | 0.0032 | 1 | 2 | positive regulation of amacrine cell differentiation |
GO:1905590 | 0.0032 | 647.72 | 0.0032 | 1 | 2 | fibronectin fibril organization |
GO:0007417 | 0.0037 | 4.7396 | 1.5549 | 6 | 970 | central nervous system development |
GO:0032501 | 0.0038 | 3.1883 | 10.7687 | 18 | 6718 | multicellular organismal process |
GO:0007412 | 0.0048 | 323.84 | 0.0048 | 1 | 3 | axon target recognition |
GO:0046952 | 0.0048 | 323.84 | 0.0048 | 1 | 3 | ketone body catabolic process |
GO:1903506 | 0.0052 | 3.1425 | 4.9291 | 11 | 3075 | regulation of nucleic acid-templated transcription |
GO:0009888 | 0.0059 | 3.5474 | 2.903 | 8 | 1811 | tissue development |
GO:0060322 | 0.006 | 4.9513 | 1.199 | 5 | 748 | head development |
GO:0019219 | 0.0062 | 2.9752 | 5.8252 | 12 | 3634 | regulation of nucleobase-containing compound metabolic process |
GO:0001550 | 0.0064 | 215.88 | 0.0064 | 1 | 4 | ovarian cumulus expansion |
GO:0061030 | 0.0064 | 215.88 | 0.0064 | 1 | 4 | epithelial cell differentiation involved in mammary gland alveolus development |
GO:0061737 | 0.0064 | 215.88 | 0.0064 | 1 | 4 | leukotriene signaling pathway |
GO:0090024 | 0.0064 | 215.88 | 0.0064 | 1 | 4 | negative regulation of neutrophil chemotaxis |
GO:0006351 | 0.0068 | 3.0058 | 5.1086 | 11 | 3187 | transcription, DNA-templated |
GO:0032774 | 0.0072 | 2.9848 | 5.1375 | 11 | 3205 | RNA biosynthetic process |
GO:0021855 | 0.008 | 161.9 | 0.008 | 1 | 5 | hypothalamus cell migration |
GO:0060120 | 0.008 | 161.9 | 0.008 | 1 | 5 | inner ear receptor cell fate commitment |
GO:0097211 | 0.008 | 161.9 | 0.008 | 1 | 5 | cellular response to gonadotropin-releasing hormone |
GO:0046533 | 0.0096 | 129.512 | 0.0096 | 1 | 6 | negative regulation of photoreceptor cell differentiation |
GO:1903911 | 0.0096 | 129.512 | 0.0096 | 1 | 6 | positive regulation of receptor clustering |
GO:0001708 | 0.0099 | 14.5851 | 0.1507 | 2 | 94 | cell fate specification |
GOMFID | Pvalue | OddsRatio | ExpCount | Count | Size | Term |
GO:0006334 | 0 | 402.1507 | 0.3078 | 31 | 104 | nucleosome assembly |
GO:0006335 | 0 | 2020.5 | 0.0947 | 24 | 32 | DNA replication-dependent chromatin assembly |
GO:0071824 | 0 | 162.9257 | 0.6215 | 31 | 210 | protein-DNA complex subunit organization |
GO:0006338 | 0 | 141.3324 | 0.7014 | 31 | 237 | chromatin remodeling |
GO:0032200 | 0 | 121.5152 | 0.4617 | 24 | 156 | telomere organization |
GO:0045653 | 0 | 1664.3529 | 0.0533 | 14 | 18 | negative regulation of megakaryocyte differentiation |
GO:0006336 | 0 | 369.5359 | 0.0947 | 14 | 32 | DNA replication-independent chromatin assembly |
GO:0065003 | 0 | 19.6238 | 4.1608 | 31 | 1406 | protein-containing complex assembly |
GO:0006352 | 0 | 60.1251 | 0.367 | 14 | 124 | DNA-templated transcription, initiation |
GO:0045637 | 0 | 35.7788 | 0.5859 | 14 | 198 | regulation of myeloid cell differentiation |
GO:0040029 | 0 | 39.1117 | 0.3936 | 11 | 133 | regulation of gene expression, epigenetic |
GO:0044085 | 0 | 9.1071 | 8.7122 | 32 | 2944 | cellular component biogenesis |
GO:0045596 | 0 | 10.416 | 1.8614 | 14 | 629 | negative regulation of cell differentiation |
GO:0002227 | 0 | 110.4993 | 0.0651 | 5 | 22 | innate immune response in mucosa |
GO:0002251 | 0 | 67.0432 | 0.0977 | 5 | 33 | organ or tissue specific immune response |
GO:0030097 | 0 | 7.8913 | 2.4148 | 14 | 816 | hemopoiesis |
GO:0002520 | 0 | 6.9872 | 2.7048 | 14 | 914 | immune system development |
GO:0019731 | 0 | 41.6718 | 0.148 | 5 | 50 | antibacterial humoral response |
GO:0051276 | 0 | 11.5977 | 1.1922 | 9 | 798 | chromosome organization |
GO:0061844 | 0 | 28.3756 | 0.2101 | 5 | 71 | antimicrobial humoral immune response mediated by antimicrobial peptide |
GO:0016043 | 0 | 4.0782 | 16.8681 | 33 | 5700 | cellular component organization |
GO:0050830 | 0 | 22.5399 | 0.2604 | 5 | 88 | defense response to Gram-positive bacterium |
GO:0002682 | 0 | 4.9197 | 3.7376 | 14 | 1263 | regulation of immune system process |
GO:2000026 | 0 | 4.7866 | 3.8323 | 14 | 1295 | regulation of multicellular organismal development |
GO:0097659 | 0 | 3.4747 | 9.4372 | 22 | 3189 | nucleic acid-templated transcription |
GO:0034654 | 2e-04 | 3.0194 | 10.5411 | 22 | 3562 | nucleobase-containing compound biosynthetic process |
GO:0006959 | 4e-04 | 8.9244 | 0.6303 | 5 | 213 | humoral immune response |
GO:0007194 | 0.0017 | 36.9634 | 0.0621 | 2 | 21 | negative regulation of adenylate cyclase activity |
GO:0010467 | 0.0019 | 3.5263 | 5.0978 | 12 | 2555 | gene expression |
GO:0009059 | 0.0028 | 2.3744 | 12.6392 | 22 | 4271 | macromolecule biosynthetic process |
GO:0097275 | 0.003 | Inf | 0.003 | 1 | 1 | cellular ammonium homeostasis |
GO:0097276 | 0.003 | Inf | 0.003 | 1 | 1 | cellular creatinine homeostasis |
GO:0097277 | 0.003 | Inf | 0.003 | 1 | 1 | cellular urea homeostasis |
GO:0016070 | 0.003 | 2.354 | 12.7191 | 22 | 4298 | RNA metabolic process |
GO:0048513 | 0.004 | 2.3902 | 9.6562 | 18 | 3263 | animal organ development |
GO:0090663 | 0.0059 | 344.0638 | 0.0059 | 1 | 2 | galanin-activated signaling pathway |
GOMFID | Pvalue | OddsRatio | ExpCount | Count | Size | Term |
GO:0045653 | 0 | 1951.9138 | 0.0477 | 14 | 18 | negative regulation of megakaryocyte differentiation |
GO:0006335 | 0 | 433.3831 | 0.0848 | 14 | 32 | DNA replication-dependent chromatin assembly |
GO:0006336 | 0 | 433.3831 | 0.0848 | 14 | 32 | DNA replication-independent chromatin assembly |
GO:0006334 | 0 | 96.8379 | 0.2757 | 15 | 104 | nucleosome assembly |
GO:0006352 | 0 | 70.5135 | 0.3287 | 14 | 124 | DNA-templated transcription, initiation |
GO:0032200 | 0 | 54.5143 | 0.4136 | 14 | 156 | telomere organization |
GO:0071824 | 0 | 43.9066 | 0.5567 | 15 | 210 | protein-DNA complex subunit organization |
GO:0006338 | 0 | 38.5014 | 0.6283 | 15 | 237 | chromatin remodeling |
GO:0045637 | 0 | 41.9606 | 0.5249 | 14 | 198 | regulation of myeloid cell differentiation |
GO:0045596 | 0 | 15.0459 | 1.6675 | 16 | 629 | negative regulation of cell differentiation |
GO:0030097 | 0 | 9.2549 | 2.1633 | 14 | 816 | hemopoiesis |
GO:0002520 | 0 | 8.1946 | 2.4231 | 14 | 914 | immune system development |
GO:0002682 | 0 | 7.095 | 3.3483 | 16 | 1263 | regulation of immune system process |
GO:2000026 | 0 | 6.9026 | 3.4331 | 16 | 1295 | regulation of multicellular organismal development |
GO:0032501 | 0 | 5.3654 | 17.8097 | 34 | 6718 | multicellular organismal process |
GO:0097659 | 0 | 4.726 | 8.4542 | 23 | 3189 | nucleic acid-templated transcription |
GO:0065003 | 0 | 5.6945 | 3.7274 | 15 | 1406 | protein-containing complex assembly |
GO:0048513 | 0 | 4.1814 | 8.6504 | 22 | 3263 | animal organ development |
GO:0034654 | 0 | 4.1067 | 9.443 | 23 | 3562 | nucleobase-containing compound biosynthetic process |
GO:0048519 | 0 | 3.7 | 13.5044 | 27 | 5094 | negative regulation of biological process |
GO:0048869 | 0 | 3.6238 | 10.3921 | 23 | 3920 | cellular developmental process |
GO:0009059 | 0 | 3.5483 | 11.3226 | 24 | 4271 | macromolecule biosynthetic process |
GO:0016070 | 0 | 3.5179 | 11.3942 | 24 | 4298 | RNA metabolic process |
GO:0065007 | 2e-04 | 5.8684 | 29.8853 | 40 | 11273 | biological regulation |
GO:0046483 | 2e-04 | 3.077 | 14.3077 | 26 | 5397 | heterocycle metabolic process |
GO:0050794 | 5e-04 | 3.8022 | 26.6271 | 37 | 10044 | regulation of cellular process |
GO:0006725 | 5e-04 | 2.913 | 14.1183 | 25 | 5452 | cellular aromatic compound metabolic process |
GO:0034641 | 5e-04 | 2.8813 | 15.9116 | 27 | 6002 | cellular nitrogen compound metabolic process |
GO:1901360 | 6e-04 | 2.848 | 15.0527 | 26 | 5678 | organic cyclic compound metabolic process |
GO:0044249 | 9e-04 | 2.724 | 13.6502 | 24 | 5149 | cellular biosynthetic process |
GO:0044085 | 0.0025 | 2.6814 | 7.8047 | 16 | 2944 | cellular component biogenesis |
GO:0021767 | 0.0027 | Inf | 0.0027 | 1 | 1 | mammillary body development |
GO:0042668 | 0.0027 | Inf | 0.0027 | 1 | 1 | auditory receptor cell fate determination |
GO:0045609 | 0.0027 | Inf | 0.0027 | 1 | 1 | positive regulation of inner ear auditory receptor cell differentiation |
GO:0045633 | 0.0027 | Inf | 0.0027 | 1 | 1 | positive regulation of mechanoreceptor differentiation |
GO:0050783 | 0.0027 | Inf | 0.0027 | 1 | 1 | cocaine metabolic process |
GO:0061374 | 0.0027 | Inf | 0.0027 | 1 | 1 | mammillothalamic axonal tract development |
GO:0061381 | 0.0027 | Inf | 0.0027 | 1 | 1 | cell migration in diencephalon |
GO:0006996 | 0.003 | 2.5353 | 9.5332 | 18 | 3596 | organelle organization |
GO:0042667 | 0.0053 | 385.1429 | 0.0053 | 1 | 2 | auditory receptor cell fate specification |
GO:0061379 | 0.0053 | 385.1429 | 0.0053 | 1 | 2 | inferior colliculus development |
GO:1905652 | 0.0053 | 385.1429 | 0.0053 | 1 | 2 | negative regulation of artery morphogenesis |
GO:0007612 | 0.0058 | 8.9122 | 0.3658 | 3 | 138 | learning |
GO:0001661 | 0.0079 | 192.5595 | 0.008 | 1 | 3 | conditioned taste aversion |
GO:0006581 | 0.0079 | 192.5595 | 0.008 | 1 | 3 | acetylcholine catabolic process |
GO:0007412 | 0.0079 | 192.5595 | 0.008 | 1 | 3 | axon target recognition |
GO:0046952 | 0.0079 | 192.5595 | 0.008 | 1 | 3 | ketone body catabolic process |
GOMFID | Pvalue | OddsRatio | ExpCount | Count | Size | Term |
GO:0014016 | 0 | 635.2157 | 0.0059 | 2 | 5 | neuroblast differentiation |
GO:0042668 | 0.0012 | Inf | 0.0012 | 1 | 1 | auditory receptor cell fate determination |
GO:0045609 | 0.0012 | Inf | 0.0012 | 1 | 1 | positive regulation of inner ear auditory receptor cell differentiation |
GO:0045633 | 0.0012 | Inf | 0.0012 | 1 | 1 | positive regulation of mechanoreceptor differentiation |
GO:0050783 | 0.0012 | Inf | 0.0012 | 1 | 1 | cocaine metabolic process |
GO:1901625 | 0.0012 | Inf | 0.0012 | 1 | 1 | cellular response to ergosterol |
GO:0022617 | 0.0021 | 33.9181 | 0.0679 | 2 | 58 | extracellular matrix disassembly |
GO:0042667 | 0.0023 | 900 | 0.0023 | 1 | 2 | auditory receptor cell fate specification |
GO:0006581 | 0.0035 | 449.9722 | 0.0035 | 1 | 3 | acetylcholine catabolic process |
GO:0060120 | 0.0058 | 224.9583 | 0.0059 | 1 | 5 | inner ear receptor cell fate commitment |
GO:0019730 | 0.0069 | 18.0347 | 0.1253 | 2 | 107 | antimicrobial humoral response |
GO:0009804 | 0.007 | 179.9556 | 0.007 | 1 | 6 | coumarin metabolic process |
GO:0019695 | 0.007 | 179.9556 | 0.007 | 1 | 6 | choline metabolic process |
GO:0036112 | 0.007 | 179.9556 | 0.007 | 1 | 6 | medium-chain fatty-acyl-CoA metabolic process |
GO:1900619 | 0.007 | 179.9556 | 0.007 | 1 | 6 | acetate ester metabolic process |
GO:0046222 | 0.0082 | 149.9537 | 0.0082 | 1 | 7 | aflatoxin metabolic process |
GO:0009820 | 0.0093 | 128.5238 | 0.0094 | 1 | 8 | alkaloid metabolic process |
GO:1903979 | 0.0093 | 128.5238 | 0.0094 | 1 | 8 | negative regulation of microglial cell activation |
GO:2000980 | 0.0093 | 128.5238 | 0.0094 | 1 | 8 | regulation of inner ear receptor cell differentiation |
GO:0007586 | 0.0097 | 15.0093 | 0.1499 | 2 | 128 | digestion |
GOMFID | Pvalue | OddsRatio | ExpCount | Count | Size | Term |
GO:0006952 | 2e-04 | 11.828 | 1.0166 | 6 | 1499 | defense response |
GO:0031640 | 3e-04 | 105.719 | 0.0244 | 2 | 36 | killing of cells of another organism |
GO:0009617 | 5e-04 | 15.154 | 0.4022 | 4 | 593 | response to bacterium |
GO:0019244 | 7e-04 | Inf | 7e-04 | 1 | 1 | lactate biosynthetic process from pyruvate |
GO:0019516 | 7e-04 | Inf | 7e-04 | 1 | 1 | lactate oxidation |
GO:0035732 | 7e-04 | Inf | 7e-04 | 1 | 1 | nitric oxide storage |
GO:0043207 | 8e-04 | 9.99 | 0.8498 | 5 | 1253 | response to external biotic stimulus |
GO:1901687 | 0.002 | 810.35 | 0.002 | 1 | 3 | glutathione derivative biosynthetic process |
GO:0051771 | 0.0027 | 540.2 | 0.0027 | 1 | 4 | negative regulation of nitric-oxide synthase biosynthetic process |
GO:0061737 | 0.0027 | 540.2 | 0.0027 | 1 | 4 | leukotriene signaling pathway |
GO:1905700 | 0.0034 | 405.125 | 0.0034 | 1 | 5 | negative regulation of xenobiotic detoxification by transmembrane export across the plasma membrane |
GO:0098754 | 0.0037 | 26.6584 | 0.0922 | 2 | 136 | detoxification |
GO:0071638 | 0.0041 | 324.08 | 0.0041 | 1 | 6 | negative regulation of monocyte chemotactic protein-1 production |
GO:2001023 | 0.0041 | 324.08 | 0.0041 | 1 | 6 | regulation of response to drug |
GO:0001936 | 0.0047 | 23.3203 | 0.1051 | 2 | 155 | regulation of endothelial cell proliferation |
GO:0035726 | 0.0047 | 270.05 | 0.0047 | 1 | 7 | common myeloid progenitor cell proliferation |
GO:0033483 | 0.0061 | 202.5125 | 0.0061 | 1 | 9 | gas homeostasis |
GO:0051122 | 0.0061 | 202.5125 | 0.0061 | 1 | 9 | hepoxilin biosynthetic process |
GO:0072330 | 0.0079 | 17.7878 | 0.137 | 2 | 202 | monocarboxylic acid biosynthetic process |
GO:0002674 | 0.0081 | 147.2545 | 0.0081 | 1 | 12 | negative regulation of acute inflammatory response |
GO:0071356 | 0.0084 | 17.1787 | 0.1417 | 2 | 209 | cellular response to tumor necrosis factor |
GOMFID | Pvalue | OddsRatio | ExpCount | Count | Size | Term |
GO:0050911 | 3e-04 | 32.341 | 0.1326 | 3 | 215 | detection of chemical stimulus involved in sensory perception of smell |
GO:0009593 | 6e-04 | 24.0332 | 0.1769 | 3 | 287 | detection of chemical stimulus |
GO:1905183 | 6e-04 | Inf | 6e-04 | 1 | 1 | negative regulation of protein serine/threonine phosphatase activity |
GO:0007606 | 7e-04 | 23.2012 | 0.1831 | 3 | 297 | sensory perception of chemical stimulus |
GO:0050906 | 8e-04 | 21.9816 | 0.193 | 3 | 313 | detection of stimulus involved in sensory perception |
GO:0032461 | 0.0012 | 1801 | 0.0012 | 1 | 2 | positive regulation of protein oligomerization |
GO:1905184 | 0.0012 | 1801 | 0.0012 | 1 | 2 | positive regulation of protein serine/threonine phosphatase activity |
GO:0061737 | 0.0025 | 600.2593 | 0.0025 | 1 | 4 | leukotriene signaling pathway |
GO:0032020 | 0.0037 | 360.1111 | 0.0037 | 1 | 6 | ISG15-protein conjugation |
GO:0045198 | 0.0092 | 128.5397 | 0.0092 | 1 | 15 | establishment of epithelial cell apical/basal polarity |
GO:0042742 | 0.0099 | 16.0251 | 0.1547 | 2 | 251 | defense response to bacterium |
GOMFID | Pvalue | OddsRatio | ExpCount | Count | Size | Term |
GO:0006334 | 0 | 180.9101 | 0.1924 | 15 | 104 | nucleosome assembly |
GO:0071824 | 0 | 94.2327 | 0.3884 | 16 | 210 | protein-DNA complex subunit organization |
GO:0006338 | 0 | 82.5805 | 0.4383 | 16 | 237 | chromatin remodeling |
GO:0006335 | 0 | 367.4545 | 0.0592 | 10 | 32 | DNA replication-dependent chromatin assembly |
GO:0040029 | 0 | 65.313 | 0.246 | 10 | 133 | regulation of gene expression, epigenetic |
GO:0032200 | 0 | 54.9452 | 0.2885 | 10 | 156 | telomere organization |
GO:0002227 | 0 | 190.2706 | 0.0407 | 5 | 22 | innate immune response in mucosa |
GO:0065003 | 0 | 12.1686 | 2.6005 | 16 | 1406 | protein-containing complex assembly |
GO:0002251 | 0 | 115.4429 | 0.061 | 5 | 33 | organ or tissue specific immune response |
GO:0019731 | 0 | 71.7556 | 0.0925 | 5 | 50 | antibacterial humoral response |
GO:0061844 | 0 | 48.8606 | 0.1313 | 5 | 71 | antimicrobial humoral immune response mediated by antimicrobial peptide |
GO:0050830 | 0 | 38.812 | 0.1628 | 5 | 88 | defense response to Gram-positive bacterium |
GO:0044085 | 0 | 5.1764 | 5.4451 | 16 | 2944 | cellular component biogenesis |
GO:0006959 | 0 | 15.3673 | 0.394 | 5 | 213 | humoral immune response |
GO:0051276 | 3e-04 | 8.2532 | 0.9935 | 6 | 798 | chromosome organization |
GO:0009617 | 0.0043 | 5.3068 | 1.0968 | 5 | 593 | response to bacterium |
GO:0016043 | 0.0047 | 2.774 | 10.5425 | 18 | 5700 | cellular component organization |
GO:0044245 | 0.0055 | 279.1034 | 0.0055 | 1 | 3 | polysaccharide digestion |
GO:0014054 | 0.0074 | 186.0575 | 0.0074 | 1 | 4 | positive regulation of gamma-aminobutyric acid secretion |
GO:0051919 | 0.0074 | 186.0575 | 0.0074 | 1 | 4 | positive regulation of fibrinolysis |
GO:0014050 | 0.0092 | 139.5345 | 0.0092 | 1 | 5 | negative regulation of glutamate secretion |
GOMFID | Pvalue | OddsRatio | ExpCount | Count | Size | Term |
GO:0009593 | 0 | 49.7656 | 0.2654 | 7 | 287 | detection of chemical stimulus |
GO:0007606 | 0 | 48.0194 | 0.2747 | 7 | 297 | sensory perception of chemical stimulus |
GO:0050906 | 0 | 45.4628 | 0.2895 | 7 | 313 | detection of stimulus involved in sensory perception |
GO:0050911 | 0 | 51.0239 | 0.1988 | 6 | 215 | detection of chemical stimulus involved in sensory perception of smell |
GO:0050877 | 0 | 14.1503 | 1.1273 | 8 | 1219 | nervous system process |
GO:0007186 | 1e-04 | 10.4938 | 0.9007 | 6 | 974 | G protein-coupled receptor signaling pathway |
GO:0010837 | 4e-04 | 80.268 | 0.0305 | 2 | 33 | regulation of keratinocyte proliferation |
GO:0045604 | 0.0012 | 45.1748 | 0.0527 | 2 | 57 | regulation of epidermal cell differentiation |
GO:0000117 | 0.0018 | 1157.4286 | 0.0018 | 1 | 2 | regulation of transcription involved in G2/M transition of mitotic cell cycle |
GO:0030573 | 0.0018 | 1157.4286 | 0.0018 | 1 | 2 | bile acid catabolic process |
GO:0030855 | 0.0024 | 8.8294 | 0.5965 | 4 | 645 | epithelial cell differentiation |
GO:0010482 | 0.0028 | 578.6786 | 0.0028 | 1 | 3 | regulation of epidermal cell division |
GO:0044278 | 0.0037 | 385.7619 | 0.0037 | 1 | 4 | cell wall disruption in another organism |
GO:0070309 | 0.0055 | 231.4286 | 0.0055 | 1 | 6 | lens fiber cell morphogenesis |
GO:0045617 | 0.0065 | 192.8452 | 0.0065 | 1 | 7 | negative regulation of keratinocyte differentiation |
GO:0051838 | 0.0074 | 165.2857 | 0.0074 | 1 | 8 | cytolysis by host of symbiont cells |
GO:0006068 | 0.0092 | 128.5397 | 0.0092 | 1 | 10 | ethanol catabolic process |
GOMFID | Pvalue | OddsRatio | ExpCount | Count | Size | Term |
GO:0050911 | 0 | 53.7446 | 0.2916 | 9 | 215 | detection of chemical stimulus involved in sensory perception of smell |
GO:0009593 | 0 | 39.6458 | 0.3893 | 9 | 287 | detection of chemical stimulus |
GO:0007606 | 0 | 38.2452 | 0.4028 | 9 | 297 | sensory perception of chemical stimulus |
GO:0050906 | 0 | 36.1959 | 0.4245 | 9 | 313 | detection of stimulus involved in sensory perception |
GO:0007186 | 0 | 10.9284 | 1.3211 | 9 | 974 | G protein-coupled receptor signaling pathway |
GO:0048252 | 0 | 1619.7 | 0.0041 | 2 | 3 | lauric acid metabolic process |
GO:0050877 | 0 | 8.5755 | 1.6534 | 9 | 1219 | nervous system process |
GO:0032501 | 1e-04 | 6.3793 | 9.112 | 18 | 6718 | multicellular organismal process |
GO:0043651 | 3e-04 | 101.1375 | 0.0244 | 2 | 18 | linoleic acid metabolic process |
GO:1901625 | 0.0014 | Inf | 0.0014 | 1 | 1 | cellular response to ergosterol |
GO:1905608 | 0.0014 | Inf | 0.0014 | 1 | 1 | positive regulation of presynapse assembly |
GO:0019369 | 0.0022 | 32.9571 | 0.0692 | 2 | 51 | arachidonic acid metabolic process |
GO:0046456 | 0.0023 | 31.6608 | 0.0719 | 2 | 53 | icosanoid biosynthetic process |
GO:0003095 | 0.0027 | 771.2857 | 0.0027 | 1 | 2 | pressure natriuresis |
GO:0031408 | 0.0027 | 771.2857 | 0.0027 | 1 | 2 | oxylipin biosynthetic process |
GO:1905652 | 0.0027 | 771.2857 | 0.0027 | 1 | 2 | negative regulation of artery morphogenesis |
GO:0036101 | 0.0054 | 257.0635 | 0.0054 | 1 | 4 | leukotriene B4 catabolic process |
GO:0051919 | 0.0054 | 257.0635 | 0.0054 | 1 | 4 | positive regulation of fibrinolysis |
GO:0050789 | 0.0067 | 5.2985 | 14.3882 | 20 | 10608 | regulation of biological process |
GO:1905700 | 0.0068 | 192.7857 | 0.0068 | 1 | 5 | negative regulation of xenobiotic detoxification by transmembrane export across the plasma membrane |
GO:0015908 | 0.0071 | 17.5065 | 0.1275 | 2 | 94 | fatty acid transport |
GO:2001023 | 0.0081 | 154.219 | 0.0081 | 1 | 6 | regulation of response to drug |
GO:0002933 | 0.0095 | 128.5079 | 0.0095 | 1 | 7 | lipid hydroxylation |
GOMFID | Pvalue | OddsRatio | ExpCount | Count | Size | Term |
GO:0050911 | 0 | 56.1932 | 0.2518 | 8 | 215 | detection of chemical stimulus involved in sensory perception of smell |
GO:0009593 | 0 | 41.5041 | 0.3362 | 8 | 287 | detection of chemical stimulus |
GO:0007606 | 0 | 40.0428 | 0.3479 | 8 | 297 | sensory perception of chemical stimulus |
GO:0050906 | 0 | 37.904 | 0.3666 | 8 | 313 | detection of stimulus involved in sensory perception |
GO:0048252 | 0 | 1905.8824 | 0.0035 | 2 | 3 | lauric acid metabolic process |
GO:0007186 | 0 | 11.47 | 1.1409 | 8 | 974 | G protein-coupled receptor signaling pathway |
GO:0050877 | 0 | 9.0023 | 1.4279 | 8 | 1219 | nervous system process |
GO:0043651 | 2e-04 | 119.0074 | 0.0211 | 2 | 18 | linoleic acid metabolic process |
GO:1901625 | 0.0012 | Inf | 0.0012 | 1 | 1 | cellular response to ergosterol |
GO:1905608 | 0.0012 | Inf | 0.0012 | 1 | 1 | positive regulation of presynapse assembly |
GO:0019369 | 0.0016 | 38.7803 | 0.0597 | 2 | 51 | arachidonic acid metabolic process |
GO:0046456 | 0.0017 | 37.2549 | 0.0621 | 2 | 53 | icosanoid biosynthetic process |
GO:0022617 | 0.0021 | 33.9181 | 0.0679 | 2 | 58 | extracellular matrix disassembly |
GO:0003095 | 0.0023 | 900 | 0.0023 | 1 | 2 | pressure natriuresis |
GO:0031408 | 0.0023 | 900 | 0.0023 | 1 | 2 | oxylipin biosynthetic process |
GO:1901568 | 0.0027 | 29.6636 | 0.0773 | 2 | 66 | fatty acid derivative metabolic process |
GO:0036101 | 0.0047 | 299.963 | 0.0047 | 1 | 4 | leukotriene B4 catabolic process |
GO:0016053 | 0.0048 | 10.1097 | 0.3491 | 3 | 298 | organic acid biosynthetic process |
GO:0015908 | 0.0053 | 20.5997 | 0.1101 | 2 | 94 | fatty acid transport |
GO:0036112 | 0.007 | 179.9556 | 0.007 | 1 | 6 | medium-chain fatty-acyl-CoA metabolic process |
GO:0002933 | 0.0082 | 149.9537 | 0.0082 | 1 | 7 | lipid hydroxylation |
GO:0006631 | 0.0088 | 8.0671 | 0.4346 | 3 | 371 | fatty acid metabolic process |
GO:0007586 | 0.0097 | 15.0093 | 0.1499 | 2 | 128 | digestion |
GOMFID | Pvalue | OddsRatio | ExpCount | Count | Size | Term |
GO:0009593 | 0 | 54.4205 | 0.5131 | 14 | 287 | detection of chemical stimulus |
GO:0050911 | 0 | 64.3122 | 0.3844 | 13 | 215 | detection of chemical stimulus involved in sensory perception of smell |
GO:0007606 | 0 | 52.4645 | 0.531 | 14 | 297 | sensory perception of chemical stimulus |
GO:0050906 | 0 | 49.6071 | 0.5596 | 14 | 313 | detection of stimulus involved in sensory perception |
GO:0007186 | 0 | 14.8079 | 1.7414 | 14 | 974 | G protein-coupled receptor signaling pathway |
GO:0050877 | 0 | 11.6074 | 2.1795 | 14 | 1219 | nervous system process |
GO:0048252 | 0 | 1199.2593 | 0.0054 | 2 | 3 | lauric acid metabolic process |
GO:0043651 | 5e-04 | 74.8843 | 0.0322 | 2 | 18 | linoleic acid metabolic process |
GO:0032078 | 0.0018 | Inf | 0.0018 | 1 | 1 | negative regulation of endodeoxyribonuclease activity |
GO:1902483 | 0.0018 | Inf | 0.0018 | 1 | 1 | cytotoxic T cell pyroptotic process |
GO:1905608 | 0.0018 | Inf | 0.0018 | 1 | 1 | positive regulation of presynapse assembly |
GO:0019884 | 0.0023 | 31.4873 | 0.0715 | 2 | 40 | antigen processing and presentation of exogenous antigen |
GO:0023052 | 0.0031 | 2.9858 | 10.2805 | 18 | 5750 | signaling |
GO:0007154 | 0.0035 | 2.9459 | 10.3699 | 18 | 5800 | cell communication |
GO:0003095 | 0.0036 | 578.2143 | 0.0036 | 1 | 2 | pressure natriuresis |
GO:0031408 | 0.0036 | 578.2143 | 0.0036 | 1 | 2 | oxylipin biosynthetic process |
GO:0019369 | 0.0037 | 24.4021 | 0.0912 | 2 | 51 | arachidonic acid metabolic process |
GO:0046456 | 0.004 | 23.4423 | 0.0948 | 2 | 53 | icosanoid biosynthetic process |
GO:0051716 | 0.0065 | 2.7491 | 11.8646 | 19 | 6636 | cellular response to stimulus |
GO:0036101 | 0.0071 | 192.7143 | 0.0072 | 1 | 4 | leukotriene B4 catabolic process |
GO:0032501 | 0.0076 | 2.6922 | 12.0112 | 19 | 6718 | multicellular organismal process |
GO:0048006 | 0.0089 | 144.5268 | 0.0089 | 1 | 5 | antigen processing and presentation, endogenous lipid antigen via MHC class Ib |
GOMFID | Pvalue | OddsRatio | ExpCount | Count | Size | Term |
GO:0009593 | 0 | 26.8455 | 0.4424 | 8 | 287 | detection of chemical stimulus |
GO:0007606 | 0 | 25.9003 | 0.4578 | 8 | 297 | sensory perception of chemical stimulus |
GO:0050906 | 0 | 24.5169 | 0.4824 | 8 | 313 | detection of stimulus involved in sensory perception |
GO:0050911 | 0 | 29.8902 | 0.3314 | 7 | 215 | detection of chemical stimulus involved in sensory perception of smell |
GO:0035195 | 1e-04 | 13.291 | 0.4686 | 5 | 304 | miRNA-mediated gene silencing |
GO:0016441 | 1e-04 | 12.7685 | 0.4871 | 5 | 316 | post-transcriptional gene silencing |
GO:0007186 | 1e-04 | 8.1982 | 1.1928 | 7 | 874 | G protein-coupled receptor signaling pathway |
GO:0031047 | 1e-04 | 11.9084 | 0.521 | 5 | 338 | gene silencing by RNA |
GO:0050877 | 3e-04 | 5.8227 | 1.8789 | 8 | 1219 | nervous system process |
GO:0007218 | 5e-04 | 22.8679 | 0.1526 | 3 | 99 | neuropeptide signaling pathway |
GO:0031640 | 0.0014 | 41.3325 | 0.0555 | 2 | 36 | killing of cells of another organism |
GO:0061737 | 0.0062 | 224.8889 | 0.0062 | 1 | 4 | leukotriene signaling pathway |
GO:1903847 | 0.0062 | 224.8889 | 0.0062 | 1 | 4 | regulation of aorta morphogenesis |
GO:0090272 | 0.0077 | 168.6562 | 0.0077 | 1 | 5 | negative regulation of fibroblast growth factor production |
GO:1905700 | 0.0077 | 168.6562 | 0.0077 | 1 | 5 | negative regulation of xenobiotic detoxification by transmembrane export across the plasma membrane |
GO:0009804 | 0.0092 | 134.9167 | 0.0092 | 1 | 6 | coumarin metabolic process |
GO:2001023 | 0.0092 | 134.9167 | 0.0092 | 1 | 6 | regulation of response to drug |
GOMFID | Pvalue | OddsRatio | ExpCount | Count | Size | Term |
GO:0045653 | 0 | 4358.5769 | 0.03 | 14 | 18 | negative regulation of megakaryocyte differentiation |
GO:0006335 | 0 | 967.735 | 0.0533 | 14 | 32 | DNA replication-dependent chromatin assembly |
GO:0006336 | 0 | 967.735 | 0.0533 | 14 | 32 | DNA replication-independent chromatin assembly |
GO:0006334 | 0 | 192.6855 | 0.1731 | 14 | 104 | nucleosome assembly |
GO:0006352 | 0 | 157.4559 | 0.2064 | 14 | 124 | DNA-templated transcription, initiation |
GO:0032200 | 0 | 121.7302 | 0.2597 | 14 | 156 | telomere organization |
GO:0045637 | 0 | 93.6982 | 0.3296 | 14 | 198 | regulation of myeloid cell differentiation |
GO:0071824 | 0 | 87.8956 | 0.3496 | 14 | 210 | protein-DNA complex subunit organization |
GO:0006338 | 0 | 77.1231 | 0.3945 | 14 | 237 | chromatin remodeling |
GO:0002520 | 0 | 28.9891 | 1.5215 | 17 | 914 | immune system development |
GO:0045596 | 0 | 31.7162 | 1.047 | 15 | 629 | negative regulation of cell differentiation |
GO:0030097 | 0 | 27.9873 | 1.3583 | 16 | 816 | hemopoiesis |
GO:0002682 | 0 | 14.969 | 2.1024 | 15 | 1263 | regulation of immune system process |
GO:2000026 | 0 | 14.5635 | 2.1557 | 15 | 1295 | regulation of multicellular organismal development |
GO:0065003 | 0 | 11.4508 | 2.3404 | 14 | 1406 | protein-containing complex assembly |
GO:0097659 | 0 | 6.9785 | 5.3084 | 17 | 3189 | nucleic acid-templated transcription |
GO:0048513 | 0 | 6.7806 | 5.4316 | 17 | 3263 | animal organ development |
GO:0048869 | 0 | 6.2998 | 6.5253 | 18 | 3920 | cellular developmental process |
GO:0034654 | 0 | 6.0653 | 5.9293 | 17 | 3562 | nucleobase-containing compound biosynthetic process |
GO:0044085 | 0 | 5.6606 | 4.9006 | 15 | 2944 | cellular component biogenesis |
GO:0009059 | 1e-04 | 4.7711 | 7.1096 | 17 | 4271 | macromolecule biosynthetic process |
GO:0016070 | 1e-04 | 4.7303 | 7.1545 | 17 | 4298 | RNA metabolic process |
GO:0032501 | 1e-04 | 4.9628 | 11.1829 | 21 | 6718 | multicellular organismal process |
GO:0006996 | 2e-04 | 4.4024 | 5.9859 | 15 | 3596 | organelle organization |
GO:0048519 | 2e-04 | 4.3802 | 8.4795 | 18 | 5094 | negative regulation of biological process |
GO:0044249 | 8e-04 | 3.664 | 8.5711 | 17 | 5149 | cellular biosynthetic process |
GO:0046483 | 0.0015 | 3.4167 | 8.9839 | 17 | 5397 | heterocycle metabolic process |
GO:0006725 | 0.0017 | 3.364 | 9.0771 | 17 | 5453 | cellular aromatic compound metabolic process |
GO:0051452 | 0.0022 | 32.306 | 0.0699 | 2 | 42 | intracellular pH reduction |
GO:1901360 | 0.0028 | 3.1628 | 9.4517 | 17 | 5678 | organic cyclic compound metabolic process |
GO:0097323 | 0.0033 | 622.7692 | 0.0033 | 1 | 2 | B cell adhesion |
GO:0065007 | 0.0043 | 5.4954 | 18.7652 | 25 | 11273 | biological regulation |
GO:0034641 | 0.0054 | 2.8995 | 9.991 | 17 | 6002 | cellular nitrogen compound metabolic process |
GO:0060465 | 0.0066 | 207.5641 | 0.0067 | 1 | 4 | pharynx development |
GO:0030641 | 0.0072 | 17.1925 | 0.1282 | 2 | 77 | regulation of cellular pH |
GO:0050794 | 0.008 | 3.5415 | 16.7194 | 23 | 10044 | regulation of cellular process |
GO:0060023 | 0.0083 | 155.6635 | 0.0083 | 1 | 5 | soft palate development |
GO:0044854 | 0.0099 | 124.5231 | 0.01 | 1 | 6 | plasma membrane raft assembly |
GO:1905460 | 0.0099 | 124.5231 | 0.01 | 1 | 6 | negative regulation of vascular associated smooth muscle cell apoptotic process |
GOMFID | Pvalue | OddsRatio | ExpCount | Count | Size | Term |
GO:0046982 | 0 | 26.6221 | 0.6216 | 11 | 300 | protein heterodimerization activity |
GO:0045296 | 0 | 21.108 | 0.6775 | 10 | 327 | cadherin binding |
GO:0004984 | 0 | 20.3506 | 0.4413 | 7 | 213 | olfactory receptor activity |
GO:0004930 | 0 | 11.1483 | 1.2431 | 10 | 600 | G protein-coupled receptor activity |
GO:0005549 | 0 | 38.1731 | 0.1264 | 4 | 61 | odorant binding |
GO:0038023 | 0 | 6.1088 | 2.4863 | 11 | 1200 | signaling receptor activity |
GO:0003677 | 4e-04 | 3.8001 | 4.7799 | 13 | 2307 | DNA binding |
GO:0004941 | 0.0021 | Inf | 0.0021 | 1 | 1 | beta2-adrenergic receptor activity |
GO:0008437 | 0.0021 | Inf | 0.0021 | 1 | 1 | thyrotropin-releasing hormone activity |
GO:0070009 | 0.0021 | Inf | 0.0021 | 1 | 1 | serine-type aminopeptidase activity |
GO:0004556 | 0.0041 | 496.2121 | 0.0041 | 1 | 2 | alpha-amylase activity |
GO:0051380 | 0.0083 | 165.3838 | 0.0083 | 1 | 4 | norepinephrine binding |
GOMFID | Pvalue | OddsRatio | ExpCount | Count | Size | Term |
GO:0004984 | 0 | 41.9445 | 0.3764 | 10 | 213 | olfactory receptor activity |
GO:0004930 | 0 | 16.3848 | 1.0603 | 11 | 600 | G protein-coupled receptor activity |
GO:0038023 | 0 | 9.0273 | 2.1207 | 12 | 1200 | signaling receptor activity |
GO:0018685 | 0 | 1213.3333 | 0.0053 | 2 | 3 | alkane 1-monooxygenase activity |
GO:0102033 | 0 | 303.2778 | 0.0106 | 2 | 6 | long-chain fatty acid omega-hydroxylase activity |
GO:0008391 | 4e-04 | 80.8198 | 0.03 | 2 | 17 | arachidonic acid monooxygenase activity |
GO:0070009 | 0.0018 | Inf | 0.0018 | 1 | 1 | serine-type aminopeptidase activity |
GO:0102116 | 0.0018 | Inf | 0.0018 | 1 | 1 | laurate hydroxylase activity |
GO:0103002 | 0.0018 | Inf | 0.0018 | 1 | 1 | 16-hydroxypalmitate dehydrogenase activity |
GO:0140625 | 0.0035 | 585 | 0.0035 | 1 | 2 | opioid growth factor receptor activity |
GO:0005549 | 0.0052 | 20.4922 | 0.1078 | 2 | 61 | odorant binding |
GO:0018858 | 0.0053 | 292.4821 | 0.0053 | 1 | 3 | benzoate-CoA ligase activity |
GO:0050051 | 0.0071 | 194.9762 | 0.0071 | 1 | 4 | leukotriene-B4 20-monooxygenase activity |
GO:0102391 | 0.0071 | 194.9762 | 0.0071 | 1 | 4 | decanoate-CoA ligase activity |
GOMFID | Pvalue | OddsRatio | ExpCount | Count | Size | Term |
GO:0004984 | 0 | 90.2578 | 0.1947 | 8 | 213 | olfactory receptor activity |
GO:0004930 | 0 | 30.5077 | 0.5484 | 8 | 600 | G protein-coupled receptor activity |
GO:0038023 | 0 | 19.1486 | 1.0969 | 9 | 1200 | signaling receptor activity |
GO:0005549 | 0 | 104.2297 | 0.0558 | 4 | 61 | odorant binding |
GO:0050591 | 9e-04 | Inf | 9e-04 | 1 | 1 | quinine 3-monooxygenase activity |
GO:0102320 | 9e-04 | Inf | 9e-04 | 1 | 1 | 1,8-cineole 2-exo-monooxygenase activity |
GO:0062181 | 0.0018 | 1171 | 0.0018 | 1 | 2 | 1-alpha,25-dihydroxyvitamin D3 23-hydroxylase activity |
GO:0030343 | 0.0027 | 585.4643 | 0.0027 | 1 | 3 | vitamin D3 25-hydroxylase activity |
GO:0062187 | 0.0027 | 585.4643 | 0.0027 | 1 | 3 | anandamide 8,9 epoxidase activity |
GO:0062188 | 0.0027 | 585.4643 | 0.0027 | 1 | 3 | anandamide 11,12 epoxidase activity |
GO:0070576 | 0.0027 | 585.4643 | 0.0027 | 1 | 3 | vitamin D 24-hydroxylase activity |
GO:0034875 | 0.0037 | 390.2857 | 0.0037 | 1 | 4 | caffeine oxidase activity |
GO:0050649 | 0.0037 | 390.2857 | 0.0037 | 1 | 4 | testosterone 6-beta-hydroxylase activity |
GO:0062189 | 0.0037 | 390.2857 | 0.0037 | 1 | 4 | anandamide 14,15 epoxidase activity |
GO:0101021 | 0.0046 | 292.6964 | 0.0046 | 1 | 5 | estrogen 2-hydroxylase activity |
GO:0101020 | 0.0073 | 167.2245 | 0.0073 | 1 | 8 | estrogen 16-alpha-hydroxylase activity |
GO:0016725 | 0.0082 | 146.3125 | 0.0082 | 1 | 9 | oxidoreductase activity, acting on CH or CH2 groups |
GO:0008401 | 0.0091 | 130.0476 | 0.0091 | 1 | 10 | retinoic acid 4-hydroxylase activity |
GOMFID | Pvalue | OddsRatio | ExpCount | Count | Size | Term |
GO:0046982 | 0 | 75.7724 | 0.8775 | 27 | 300 | protein heterodimerization activity |
GO:0003677 | 0 | 13.6296 | 6.7481 | 33 | 2307 | DNA binding |
GO:0019904 | 0 | 10.2485 | 1.8896 | 14 | 646 | protein domain specific binding |
GO:0097159 | 0 | 5.6282 | 16.7459 | 36 | 5725 | organic cyclic compound binding |
GO:0045296 | 0 | 13.3198 | 0.9565 | 10 | 327 | cadherin binding |
GO:1901363 | 0 | 5.1488 | 16.5353 | 35 | 5653 | heterocyclic compound binding |
GO:0003723 | 2e-04 | 3.664 | 4.8761 | 14 | 1667 | RNA binding |
GO:0004941 | 0.0029 | Inf | 0.0029 | 1 | 1 | beta2-adrenergic receptor activity |
GO:0008437 | 0.0029 | Inf | 0.0029 | 1 | 1 | thyrotropin-releasing hormone activity |
GO:0017172 | 0.0029 | Inf | 0.0029 | 1 | 1 | cysteine dioxygenase activity |
GO:0050591 | 0.0029 | Inf | 0.0029 | 1 | 1 | quinine 3-monooxygenase activity |
GO:0070009 | 0.0029 | Inf | 0.0029 | 1 | 1 | serine-type aminopeptidase activity |
GO:0102320 | 0.0029 | Inf | 0.0029 | 1 | 1 | 1,8-cineole 2-exo-monooxygenase activity |
GO:0062181 | 0.0058 | 348.1064 | 0.0059 | 1 | 2 | 1-alpha,25-dihydroxyvitamin D3 23-hydroxylase activity |
GO:0030343 | 0.0088 | 174.0426 | 0.0088 | 1 | 3 | vitamin D3 25-hydroxylase activity |
GO:0062187 | 0.0088 | 174.0426 | 0.0088 | 1 | 3 | anandamide 8,9 epoxidase activity |
GO:0062188 | 0.0088 | 174.0426 | 0.0088 | 1 | 3 | anandamide 11,12 epoxidase activity |
GO:0070576 | 0.0088 | 174.0426 | 0.0088 | 1 | 3 | vitamin D 24-hydroxylase activity |
GOMFID | Pvalue | OddsRatio | ExpCount | Count | Size | Term |
GO:0003690 | 4e-04 | 4.5851 | 2.93 | 10 | 1551 | double-stranded DNA binding |
GO:0000981 | 4e-04 | 4.8961 | 2.4029 | 9 | 1272 | DNA-binding transcription factor activity, RNA polymerase II-specific |
GO:0000976 | 9e-04 | 4.3873 | 2.6561 | 9 | 1406 | transcription cis-regulatory region binding |
GO:0043565 | 0.0018 | 3.9222 | 2.9394 | 9 | 1556 | sequence-specific DNA binding |
GO:0070009 | 0.0019 | Inf | 0.0019 | 1 | 1 | serine-type aminopeptidase activity |
GO:0008188 | 0.0028 | 28.1707 | 0.0793 | 2 | 42 | neuropeptide receptor activity |
GO:0008260 | 0.0038 | 545.9333 | 0.0038 | 1 | 2 | 3-oxoacid CoA-transferase activity |
GO:0016499 | 0.0038 | 545.9333 | 0.0038 | 1 | 2 | orexin receptor activity |
GO:0000978 | 0.0041 | 4.0238 | 2.1044 | 7 | 1114 | RNA polymerase II cis-regulatory region sequence-specific DNA binding |
GO:0140110 | 0.0044 | 3.3829 | 3.355 | 9 | 1776 | transcription regulator activity |
GO:0004930 | 0.005 | 5.1015 | 1.1335 | 5 | 600 | G protein-coupled receptor activity |
GO:0038023 | 0.0061 | 3.7127 | 2.2669 | 7 | 1200 | signaling receptor activity |
GO:0046870 | 0.0094 | 136.4583 | 0.0094 | 1 | 5 | cadmium ion binding |
GOMFID | Pvalue | OddsRatio | ExpCount | Count | Size | Term |
GO:0018685 | 0 | 2981.0909 | 0.0024 | 2 | 3 | alkane 1-monooxygenase activity |
GO:0102033 | 0 | 745.1364 | 0.0048 | 2 | 6 | long-chain fatty acid omega-hydroxylase activity |
GO:0008391 | 1e-04 | 198.5697 | 0.0135 | 2 | 17 | arachidonic acid monooxygenase activity |
GO:0102116 | 8e-04 | Inf | 8e-04 | 1 | 1 | laurate hydroxylase activity |
GO:0103002 | 8e-04 | Inf | 8e-04 | 1 | 1 | 16-hydroxypalmitate dehydrogenase activity |
GO:0140625 | 0.0016 | 1366.3333 | 0.0016 | 1 | 2 | opioid growth factor receptor activity |
GO:0050051 | 0.0032 | 455.3889 | 0.0032 | 1 | 4 | leukotriene-B4 20-monooxygenase activity |
GO:0020037 | 0.0042 | 24.0562 | 0.099 | 2 | 125 | heme binding |
GO:0005506 | 0.0051 | 21.9017 | 0.1085 | 2 | 137 | iron ion binding |
GOMFID | Pvalue | OddsRatio | ExpCount | Count | Size | Term |
GO:1903231 | 4e-04 | 25.214 | 0.1448 | 3 | 132 | mRNA base-pairing post-transcriptional repressor activity |
GO:0004984 | 0.0015 | 15.4114 | 0.2336 | 3 | 213 | olfactory receptor activity |
GO:0001632 | 0.0022 | 964.1765 | 0.0022 | 1 | 2 | leukotriene B4 receptor activity |
GO:0045182 | 0.0025 | 12.9136 | 0.2775 | 3 | 253 | translation regulator activity |
GO:0004930 | 0.0036 | 7.5724 | 0.6581 | 4 | 600 | G protein-coupled receptor activity |
GO:0031730 | 0.0066 | 192.7882 | 0.0066 | 1 | 6 | CCR5 chemokine receptor binding |
GO:0038023 | 0.008 | 4.8912 | 1.3163 | 5 | 1200 | signaling receptor activity |
GO:0016175 | 0.0087 | 137.6891 | 0.0088 | 1 | 8 | superoxide-generating NAD(P)H oxidase activity |
GO:0019864 | 0.0098 | 120.4706 | 0.0099 | 1 | 9 | IgG binding |
GOMFID | Pvalue | OddsRatio | ExpCount | Count | Size | Term |
GO:0060089 | 5e-04 | 6.3688 | 1.5356 | 7 | 1200 | molecular transducer activity |
GO:0004888 | 0.0012 | 6.2352 | 1.272 | 6 | 994 | transmembrane signaling receptor activity |
GO:0046817 | 0.0013 | Inf | 0.0013 | 1 | 1 | chemokine receptor antagonist activity |
GO:0050591 | 0.0013 | Inf | 0.0013 | 1 | 1 | quinine 3-monooxygenase activity |
GO:0102320 | 0.0013 | Inf | 0.0013 | 1 | 1 | 1,8-cineole 2-exo-monooxygenase activity |
GO:0031729 | 0.0026 | 819.4 | 0.0026 | 1 | 2 | CCR4 chemokine receptor binding |
GO:0045519 | 0.0026 | 819.4 | 0.0026 | 1 | 2 | interleukin-23 receptor binding |
GO:0062181 | 0.0026 | 819.4 | 0.0026 | 1 | 2 | 1-alpha,25-dihydroxyvitamin D3 23-hydroxylase activity |
GO:0102338 | 0.0026 | 819.4 | 0.0026 | 1 | 2 | 3-oxo-lignoceronyl-CoA synthase activity |
GO:0030298 | 0.0038 | 409.675 | 0.0038 | 1 | 3 | receptor signaling protein tyrosine kinase activator activity |
GO:0030343 | 0.0038 | 409.675 | 0.0038 | 1 | 3 | vitamin D3 25-hydroxylase activity |
GO:0062187 | 0.0038 | 409.675 | 0.0038 | 1 | 3 | anandamide 8,9 epoxidase activity |
GO:0062188 | 0.0038 | 409.675 | 0.0038 | 1 | 3 | anandamide 11,12 epoxidase activity |
GO:0070576 | 0.0038 | 409.675 | 0.0038 | 1 | 3 | vitamin D 24-hydroxylase activity |
GO:0102336 | 0.0038 | 409.675 | 0.0038 | 1 | 3 | 3-oxo-arachidoyl-CoA synthase activity |
GO:0031726 | 0.0051 | 273.1 | 0.0051 | 1 | 4 | CCR1 chemokine receptor binding |
GO:0034875 | 0.0051 | 273.1 | 0.0051 | 1 | 4 | caffeine oxidase activity |
GO:0050649 | 0.0051 | 273.1 | 0.0051 | 1 | 4 | testosterone 6-beta-hydroxylase activity |
GO:0062189 | 0.0051 | 273.1 | 0.0051 | 1 | 4 | anandamide 14,15 epoxidase activity |
GO:0101021 | 0.0064 | 204.8125 | 0.0064 | 1 | 5 | estrogen 2-hydroxylase activity |
GO:0031730 | 0.0077 | 163.84 | 0.0077 | 1 | 6 | CCR5 chemokine receptor binding |
GO:0009922 | 0.0089 | 136.525 | 0.009 | 1 | 7 | fatty acid elongase activity |
GO:0102756 | 0.0089 | 136.525 | 0.009 | 1 | 7 | very-long-chain 3-ketoacyl-CoA synthase activity |
GOMFID | Pvalue | OddsRatio | ExpCount | Count | Size | Term |
GO:0003690 | 0 | 7.2334 | 2.6464 | 12 | 1551 | double-stranded DNA binding |
GO:0000978 | 0 | 7.6882 | 1.9008 | 10 | 1114 | RNA polymerase II cis-regulatory region sequence-specific DNA binding |
GO:0000976 | 0 | 6.9516 | 2.399 | 11 | 1406 | transcription cis-regulatory region binding |
GO:0043565 | 0 | 6.2139 | 2.655 | 11 | 1556 | sequence-specific DNA binding |
GO:0140110 | 1e-04 | 5.3587 | 3.0303 | 11 | 1776 | transcription regulator activity |
GO:0000981 | 2e-04 | 7.5288 | 1.2532 | 7 | 834 | DNA-binding transcription factor activity, RNA polymerase II-specific |
GO:0031490 | 6e-04 | 20.7932 | 0.1655 | 3 | 97 | chromatin DNA binding |
GO:0001632 | 0.0034 | 606.7037 | 0.0034 | 1 | 2 | leukotriene B4 receptor activity |
GO:0008260 | 0.0034 | 606.7037 | 0.0034 | 1 | 2 | 3-oxoacid CoA-transferase activity |
GO:0003676 | 0.0059 | 2.8637 | 6.5163 | 13 | 3819 | nucleic acid binding |
GO:0001228 | 0.0062 | 6.1244 | 0.7473 | 4 | 438 | DNA-binding transcription activator activity, RNA polymerase II-specific |
GOMFID | Pvalue | OddsRatio | ExpCount | Count | Size | Term |
GO:0050591 | 9e-04 | Inf | 9e-04 | 1 | 1 | quinine 3-monooxygenase activity |
GO:0102320 | 9e-04 | Inf | 9e-04 | 1 | 1 | 1,8-cineole 2-exo-monooxygenase activity |
GO:0062181 | 0.0017 | 1261.1538 | 0.0017 | 1 | 2 | 1-alpha,25-dihydroxyvitamin D3 23-hydroxylase activity |
GO:0106386 | 0.0017 | 1261.1538 | 0.0017 | 1 | 2 | (3R)-hydroxyacyl-CoA dehydrogenase (NAD) activity |
GO:0030343 | 0.0026 | 630.5385 | 0.0026 | 1 | 3 | vitamin D3 25-hydroxylase activity |
GO:0062187 | 0.0026 | 630.5385 | 0.0026 | 1 | 3 | anandamide 8,9 epoxidase activity |
GO:0062188 | 0.0026 | 630.5385 | 0.0026 | 1 | 3 | anandamide 11,12 epoxidase activity |
GO:0070404 | 0.0026 | 630.5385 | 0.0026 | 1 | 3 | NADH binding |
GO:0070576 | 0.0026 | 630.5385 | 0.0026 | 1 | 3 | vitamin D 24-hydroxylase activity |
GO:0034875 | 0.0034 | 420.3333 | 0.0034 | 1 | 4 | caffeine oxidase activity |
GO:0050649 | 0.0034 | 420.3333 | 0.0034 | 1 | 4 | testosterone 6-beta-hydroxylase activity |
GO:0062189 | 0.0034 | 420.3333 | 0.0034 | 1 | 4 | anandamide 14,15 epoxidase activity |
GO:0101021 | 0.0043 | 315.2308 | 0.0043 | 1 | 5 | estrogen 2-hydroxylase activity |
GO:0047035 | 0.006 | 210.1282 | 0.006 | 1 | 7 | testosterone dehydrogenase (NAD+) activity |
GO:0035197 | 0.0068 | 180.0989 | 0.0068 | 1 | 8 | siRNA binding |
GO:0101020 | 0.0068 | 180.0989 | 0.0068 | 1 | 8 | estrogen 16-alpha-hydroxylase activity |
GO:0016725 | 0.0077 | 157.5769 | 0.0077 | 1 | 9 | oxidoreductase activity, acting on CH or CH2 groups |
GO:0008401 | 0.0085 | 140.0598 | 0.0085 | 1 | 10 | retinoic acid 4-hydroxylase activity |
GO:0097677 | 0.0093 | 126.0462 | 0.0094 | 1 | 11 | STAT family protein binding |
GOMFID | Pvalue | OddsRatio | ExpCount | Count | Size | Term |
GO:0046982 | 0 | 82.4533 | 0.4936 | 16 | 300 | protein heterodimerization activity |
GO:0019904 | 0 | 26.8396 | 1.0629 | 14 | 646 | protein domain specific binding |
GO:0003723 | 0 | 11.1463 | 2.7428 | 15 | 1667 | RNA binding |
GO:0003677 | 0 | 10.4621 | 3.7958 | 17 | 2307 | DNA binding |
GO:1901363 | 6e-04 | 3.8147 | 9.3011 | 18 | 5653 | heterocyclic compound binding |
GO:0097159 | 8e-04 | 3.7414 | 9.4196 | 18 | 5725 | organic cyclic compound binding |
GO:0019834 | 0.0082 | 157.4904 | 0.0082 | 1 | 5 | phospholipase A2 inhibitor activity |
GOMFID | Pvalue | OddsRatio | ExpCount | Count | Size | Term |
GO:0008260 | 0.0026 | 819.4 | 0.0026 | 1 | 2 | 3-oxoacid CoA-transferase activity |
GO:0016262 | 0.0026 | 819.4 | 0.0026 | 1 | 2 | protein N-acetylglucosaminyltransferase activity |
GO:0045519 | 0.0026 | 819.4 | 0.0026 | 1 | 2 | interleukin-23 receptor binding |
GO:0050613 | 0.0026 | 819.4 | 0.0026 | 1 | 2 | delta14-sterol reductase activity |
GO:0016503 | 0.0038 | 409.675 | 0.0038 | 1 | 3 | pheromone receptor activity |
GO:0019834 | 0.0064 | 204.8125 | 0.0064 | 1 | 5 | phospholipase A2 inhibitor activity |
GO:0045569 | 0.0064 | 204.8125 | 0.0064 | 1 | 5 | TRAIL binding |
GO:0030881 | 0.0077 | 163.84 | 0.0077 | 1 | 6 | beta-2-microglobulin binding |
GOMFID | Pvalue | OddsRatio | ExpCount | Count | Size | Term |
GO:0046982 | 0 | 106.7463 | 0.9141 | 32 | 300 | protein heterodimerization activity |
GO:0003677 | 0 | 19.6657 | 7.0293 | 38 | 2307 | DNA binding |
GO:1901363 | 0 | 8.7247 | 17.2243 | 41 | 5653 | heterocyclic compound binding |
GO:0097159 | 0 | 8.5565 | 17.4436 | 41 | 5725 | organic cyclic compound binding |
GO:0019904 | 0 | 9.6779 | 1.9683 | 14 | 646 | protein domain specific binding |
GO:0045296 | 0 | 12.6522 | 0.9963 | 10 | 327 | cadherin binding |
GO:0003723 | 1e-04 | 3.8156 | 5.0792 | 15 | 1667 | RNA binding |
GO:0008437 | 0.003 | Inf | 0.003 | 1 | 1 | thyrotropin-releasing hormone activity |
GO:0070009 | 0.003 | Inf | 0.003 | 1 | 1 | serine-type aminopeptidase activity |
GOMFID | Pvalue | OddsRatio | ExpCount | Count | Size | Term |
GO:0046982 | 0 | 26.2378 | 0.8044 | 14 | 300 | protein heterodimerization activity |
GO:0003677 | 0 | 14.7201 | 1.6008 | 14 | 719 | DNA binding |
GO:0019904 | 0 | 11.6179 | 1.7321 | 14 | 646 | protein domain specific binding |
GO:0003723 | 0 | 4.607 | 4.4697 | 15 | 1667 | RNA binding |
GO:1901363 | 2e-04 | 3.0319 | 15.1573 | 27 | 5653 | heterocyclic compound binding |
GO:0097159 | 3e-04 | 2.9736 | 15.3504 | 27 | 5725 | organic cyclic compound binding |
GO:0003690 | 0.0021 | 3.2091 | 4.1587 | 11 | 1551 | double-stranded DNA binding |
GO:0031490 | 0.0022 | 12.6663 | 0.2601 | 3 | 97 | chromatin DNA binding |
GO:0070009 | 0.0027 | Inf | 0.0027 | 1 | 1 | serine-type aminopeptidase activity |
GO:0003990 | 0.0054 | 380.5814 | 0.0054 | 1 | 2 | acetylcholinesterase activity |
GO:0008260 | 0.0054 | 380.5814 | 0.0054 | 1 | 2 | 3-oxoacid CoA-transferase activity |
GO:0000981 | 0.0059 | 3.0749 | 3.4106 | 9 | 1272 | DNA-binding transcription factor activity, RNA polymerase II-specific |
GO:0033265 | 0.008 | 190.2791 | 0.008 | 1 | 3 | choline binding |
GO:0000978 | 0.0087 | 3.0661 | 2.987 | 8 | 1114 | RNA polymerase II cis-regulatory region sequence-specific DNA binding |
GOMFID | Pvalue | OddsRatio | ExpCount | Count | Size | Term |
GO:0008389 | 0.0014 | Inf | 0.0014 | 1 | 1 | coumarin 7-hydroxylase activity |
GO:0003990 | 0.0028 | 744.8182 | 0.0028 | 1 | 2 | acetylcholinesterase activity |
GO:0018858 | 0.0042 | 372.3864 | 0.0042 | 1 | 3 | benzoate-CoA ligase activity |
GO:0033265 | 0.0042 | 372.3864 | 0.0042 | 1 | 3 | choline binding |
GO:0102391 | 0.0056 | 248.2424 | 0.0056 | 1 | 4 | decanoate-CoA ligase activity |
GO:0031490 | 0.0081 | 16.3328 | 0.136 | 2 | 97 | chromatin DNA binding |
GO:0004321 | 0.0098 | 124.0985 | 0.0098 | 1 | 7 | fatty-acyl-CoA synthase activity |
GOMFID | Pvalue | OddsRatio | ExpCount | Count | Size | Term |
GO:0018685 | 0 | 1489.5455 | 0.0044 | 2 | 3 | alkane 1-monooxygenase activity |
GO:0004984 | 0 | 20.4681 | 0.3115 | 5 | 213 | olfactory receptor activity |
GO:0102033 | 0 | 372.3182 | 0.0088 | 2 | 6 | long-chain fatty acid omega-hydroxylase activity |
GO:0004930 | 2e-04 | 8.862 | 0.8775 | 6 | 600 | G protein-coupled receptor activity |
GO:0008391 | 3e-04 | 99.2182 | 0.0249 | 2 | 17 | arachidonic acid monooxygenase activity |
GO:0102116 | 0.0015 | Inf | 0.0015 | 1 | 1 | laurate hydroxylase activity |
GO:0103002 | 0.0015 | Inf | 0.0015 | 1 | 1 | 16-hydroxypalmitate dehydrogenase activity |
GO:0004252 | 0.0017 | 14.3966 | 0.2399 | 3 | 164 | serine-type endopeptidase activity |
GO:0017171 | 0.0024 | 12.719 | 0.2706 | 3 | 185 | serine hydrolase activity |
GO:0018858 | 0.0044 | 356.1739 | 0.0044 | 1 | 3 | benzoate-CoA ligase activity |
GO:0050051 | 0.0058 | 237.4348 | 0.0059 | 1 | 4 | leukotriene-B4 20-monooxygenase activity |
GO:0102391 | 0.0058 | 237.4348 | 0.0059 | 1 | 4 | decanoate-CoA ligase activity |
GO:0038023 | 0.0065 | 4.2412 | 1.755 | 6 | 1200 | signaling receptor activity |
GOMFID | Pvalue | OddsRatio | ExpCount | Count | Size | Term |
GO:0004190 | 1e-04 | 148.8727 | 0.0176 | 2 | 24 | aspartic-type endopeptidase activity |
GO:0035730 | 7e-04 | Inf | 7e-04 | 1 | 1 | S-nitrosoglutathione binding |
GO:0035731 | 7e-04 | Inf | 7e-04 | 1 | 1 | dinitrosyl-iron complex binding |
GO:0001632 | 0.0015 | 1490.6364 | 0.0015 | 1 | 2 | leukotriene B4 receptor activity |
GO:0070026 | 0.0022 | 745.2727 | 0.0022 | 1 | 3 | nitric oxide binding |
GO:0004459 | 0.0037 | 372.5909 | 0.0037 | 1 | 5 | L-lactate dehydrogenase activity |
GO:0008432 | 0.0066 | 186.25 | 0.0066 | 1 | 9 | JUN kinase binding |
GO:0019864 | 0.0066 | 186.25 | 0.0066 | 1 | 9 | IgG binding |
GOMFID | Pvalue | OddsRatio | ExpCount | Count | Size | Term |
GO:0001874 | 0.0014 | Inf | 0.0014 | 1 | 1 | (1->3)-beta-D-glucan immune receptor activity |
GO:0031707 | 0.0014 | Inf | 0.0014 | 1 | 1 | endothelin A receptor binding |
GO:0001872 | 0.0028 | 744.8182 | 0.0028 | 1 | 2 | (1->3)-beta-D-glucan binding |
GO:0032558 | 0.0028 | 744.8182 | 0.0028 | 1 | 2 | adenyl deoxyribonucleotide binding |
GO:0008426 | 0.0042 | 372.3864 | 0.0042 | 1 | 3 | protein kinase C inhibitor activity |
GO:0008853 | 0.0042 | 372.3864 | 0.0042 | 1 | 3 | exodeoxyribonuclease III activity |
GO:0031708 | 0.0042 | 372.3864 | 0.0042 | 1 | 3 | endothelin B receptor binding |
GO:0032552 | 0.0056 | 248.2424 | 0.0056 | 1 | 4 | deoxyribonucleotide binding |
GO:1905172 | 0.0056 | 248.2424 | 0.0056 | 1 | 4 | RISC complex binding |
GO:0019834 | 0.007 | 186.1705 | 0.007 | 1 | 5 | phospholipase A2 inhibitor activity |
GO:0015349 | 0.0084 | 148.9273 | 0.0084 | 1 | 6 | thyroid hormone transmembrane transporter activity |
GO:0032405 | 0.0084 | 148.9273 | 0.0084 | 1 | 6 | MutLalpha complex binding |
GO:0032407 | 0.0098 | 124.0985 | 0.0098 | 1 | 7 | MutSalpha complex binding |
GOMFID | Pvalue | OddsRatio | ExpCount | Count | Size | Term |
GO:0008009 | 2e-04 | 114.007 | 0.0236 | 2 | 43 | chemokine activity |
GO:0001874 | 5e-04 | Inf | 5e-04 | 1 | 1 | (1->3)-beta-D-glucan immune receptor activity |
GO:0001872 | 0.0011 | 2050 | 0.0011 | 1 | 2 | (1->3)-beta-D-glucan binding |
GO:0031726 | 0.0022 | 683.25 | 0.0022 | 1 | 4 | CCR1 chemokine receptor binding |
GO:0031728 | 0.0027 | 512.4062 | 0.0027 | 1 | 5 | CCR3 chemokine receptor binding |
GO:0031730 | 0.0033 | 409.9 | 0.0033 | 1 | 6 | CCR5 chemokine receptor binding |
GO:0004865 | 0.006 | 204.8875 | 0.006 | 1 | 11 | protein serine/threonine phosphatase inhibitor activity |
GO:0031386 | 0.006 | 204.8875 | 0.006 | 1 | 11 | protein tag |
GO:0016004 | 0.0066 | 186.25 | 0.0066 | 1 | 12 | phospholipase activator activity |
GO:0005126 | 0.0069 | 19.8259 | 0.1289 | 2 | 235 | cytokine receptor binding |
GO:0030246 | 0.0077 | 18.6859 | 0.1366 | 2 | 249 | carbohydrate binding |
GO:0001846 | 0.0082 | 146.3125 | 0.0082 | 1 | 15 | opsonin binding |
GO:0001664 | 0.0086 | 17.6683 | 0.1442 | 2 | 263 | G protein-coupled receptor binding |
GO:0004698 | 0.0087 | 136.55 | 0.0088 | 1 | 16 | calcium-dependent protein kinase C activity |
GOMFID | Pvalue | OddsRatio | ExpCount | Count | Size | Term |
GO:0004984 | 2e-04 | 33.0408 | 0.1298 | 3 | 213 | olfactory receptor activity |
GO:0001632 | 0.0012 | 1822.1111 | 0.0012 | 1 | 2 | leukotriene B4 receptor activity |
GO:0017060 | 0.0012 | 1822.1111 | 0.0012 | 1 | 2 | 3-galactosyl-N-acetylglucosaminide 4-alpha-L-fucosyltransferase activity |
GO:0004930 | 0.0032 | 13.554 | 0.3217 | 3 | 586 | G protein-coupled receptor activity |
GO:0017083 | 0.0037 | 364.3333 | 0.0037 | 1 | 6 | 4-galactosyl-N-acetylglucosaminide 3-alpha-L-fucosyltransferase activity |
GO:0038023 | 0.0042 | 8.4749 | 0.7313 | 4 | 1200 | signaling receptor activity |
GO:0004865 | 0.0067 | 182.1111 | 0.0067 | 1 | 11 | protein serine/threonine phosphatase inhibitor activity |
GO:0031386 | 0.0067 | 182.1111 | 0.0067 | 1 | 11 | protein tag |
GO:0004953 | 0.0085 | 140.0598 | 0.0085 | 1 | 14 | icosanoid receptor activity |
GOMFID | Pvalue | OddsRatio | ExpCount | Count | Size | Term |
GO:0004984 | 1e-04 | 23.8263 | 0.2207 | 4 | 213 | olfactory receptor activity |
GO:0004930 | 3e-04 | 11.063 | 0.6216 | 5 | 600 | G protein-coupled receptor activity |
GO:0038023 | 9e-04 | 6.9434 | 1.2431 | 6 | 1200 | signaling receptor activity |
GO:0001874 | 0.001 | Inf | 0.001 | 1 | 1 | (1->3)-beta-D-glucan immune receptor activity |
GO:0031707 | 0.001 | Inf | 0.001 | 1 | 1 | endothelin A receptor binding |
GO:0001872 | 0.0021 | 1024.5 | 0.0021 | 1 | 2 | (1->3)-beta-D-glucan binding |
GO:0008426 | 0.0031 | 512.2188 | 0.0031 | 1 | 3 | protein kinase C inhibitor activity |
GO:0031708 | 0.0031 | 512.2188 | 0.0031 | 1 | 3 | endothelin B receptor binding |
GO:1905172 | 0.0041 | 341.4583 | 0.0041 | 1 | 4 | RISC complex binding |
GO:0008508 | 0.0052 | 256.0781 | 0.0052 | 1 | 5 | bile acid:sodium symporter activity |
GO:1903231 | 0.0081 | 16.68 | 0.1367 | 2 | 132 | mRNA base-pairing post-transcriptional repressor activity |
GOMFID | Pvalue | OddsRatio | ExpCount | Count | Size | Term |
GO:0031707 | 7e-04 | Inf | 7e-04 | 1 | 1 | endothelin A receptor binding |
GO:0031708 | 0.002 | 819.85 | 0.002 | 1 | 3 | endothelin B receptor binding |
GO:0033038 | 0.0093 | 126.0462 | 0.0094 | 1 | 14 | bitter taste receptor activity |
GOMFID | Pvalue | OddsRatio | ExpCount | Count | Size | Term |
GO:0046982 | 0 | 60.4507 | 0.5667 | 16 | 300 | protein heterodimerization activity |
GO:0045296 | 0 | 24.128 | 0.6177 | 10 | 327 | cadherin binding |
GO:0003677 | 0 | 7.4708 | 4.3581 | 17 | 2307 | DNA binding |
GO:0008437 | 0.0019 | Inf | 0.0019 | 1 | 1 | thyrotropin-releasing hormone activity |
GO:0070009 | 0.0019 | Inf | 0.0019 | 1 | 1 | serine-type aminopeptidase activity |
GO:0004556 | 0.0038 | 545.9333 | 0.0038 | 1 | 2 | alpha-amylase activity |
GO:1901363 | 0.006 | 2.64 | 10.679 | 18 | 5653 | heterocyclic compound binding |
GO:0097159 | 0.0069 | 2.5892 | 10.8151 | 18 | 5725 | organic cyclic compound binding |
GOMFID | Pvalue | OddsRatio | ExpCount | Count | Size | Term |
GO:0004984 | 0 | 52.1353 | 0.1947 | 6 | 213 | olfactory receptor activity |
GO:0004930 | 0 | 17.734 | 0.5484 | 6 | 600 | G protein-coupled receptor activity |
GO:0038023 | 0 | 11.1498 | 1.0969 | 7 | 1200 | signaling receptor activity |
GO:0047704 | 9e-04 | Inf | 9e-04 | 1 | 1 | bile-salt sulfotransferase activity |
GO:0005549 | 0.0014 | 42.5971 | 0.0558 | 2 | 61 | odorant binding |
GO:0004027 | 0.0018 | 1171 | 0.0018 | 1 | 2 | alcohol sulfotransferase activity |
GO:0008426 | 0.0027 | 585.4643 | 0.0027 | 1 | 3 | protein kinase C inhibitor activity |
GO:0003696 | 0.0037 | 390.2857 | 0.0037 | 1 | 4 | satellite DNA binding |
GO:0050294 | 0.0037 | 390.2857 | 0.0037 | 1 | 4 | steroid sulfotransferase activity |
GO:0019237 | 0.0055 | 234.1429 | 0.0055 | 1 | 6 | centromeric DNA binding |
GO:0031849 | 0.0055 | 234.1429 | 0.0055 | 1 | 6 | olfactory receptor binding |
GO:0050656 | 0.0073 | 167.2245 | 0.0073 | 1 | 8 | 3'-phosphoadenosine 5'-phosphosulfate binding |
GOMFID | Pvalue | OddsRatio | ExpCount | Count | Size | Term |
GO:0004930 | 0 | 12.2743 | 0.6947 | 6 | 600 | G protein-coupled receptor activity |
GO:0004984 | 1e-04 | 20.6469 | 0.2466 | 4 | 213 | olfactory receptor activity |
GO:0038023 | 0.0018 | 5.8744 | 1.3894 | 6 | 1200 | signaling receptor activity |
GO:0003696 | 0.0046 | 303.4815 | 0.0046 | 1 | 4 | satellite DNA binding |
GO:0019237 | 0.0069 | 182.0667 | 0.0069 | 1 | 6 | centromeric DNA binding |
GOMFID | Pvalue | OddsRatio | ExpCount | Count | Size | Term |
GO:0004984 | 0 | 59.5037 | 0.2726 | 9 | 213 | olfactory receptor activity |
GO:0004930 | 0 | 20.0482 | 0.7678 | 9 | 600 | G protein-coupled receptor activity |
GO:0038023 | 0 | 11.6112 | 1.5356 | 10 | 1200 | signaling receptor activity |
GO:0018685 | 0 | 1725.0526 | 0.0038 | 2 | 3 | alkane 1-monooxygenase activity |
GO:0102033 | 0 | 431.1842 | 0.0077 | 2 | 6 | long-chain fatty acid omega-hydroxylase activity |
GO:0008391 | 2e-04 | 114.9053 | 0.0218 | 2 | 17 | arachidonic acid monooxygenase activity |
GO:0070009 | 0.0013 | Inf | 0.0013 | 1 | 1 | serine-type aminopeptidase activity |
GO:0102116 | 0.0013 | Inf | 0.0013 | 1 | 1 | laurate hydroxylase activity |
GO:0103002 | 0.0013 | Inf | 0.0013 | 1 | 1 | 16-hydroxypalmitate dehydrogenase activity |
GO:0050051 | 0.0051 | 273.1 | 0.0051 | 1 | 4 | leukotriene-B4 20-monooxygenase activity |
GOMFID | Pvalue | OddsRatio | ExpCount | Count | Size | Term |
GO:0004984 | 0 | 57.4226 | 0.2466 | 8 | 213 | olfactory receptor activity |
GO:0004930 | 0 | 19.4091 | 0.6947 | 8 | 600 | G protein-coupled receptor activity |
GO:0038023 | 0 | 11.4861 | 1.3894 | 9 | 1200 | signaling receptor activity |
GO:0018685 | 0 | 1928.2353 | 0.0035 | 2 | 3 | alkane 1-monooxygenase activity |
GO:0102033 | 0 | 481.9706 | 0.0069 | 2 | 6 | long-chain fatty acid omega-hydroxylase activity |
GO:0008391 | 2e-04 | 128.4392 | 0.0197 | 2 | 17 | arachidonic acid monooxygenase activity |
GO:0004252 | 8e-04 | 18.9014 | 0.1899 | 3 | 164 | serine-type endopeptidase activity |
GO:0102116 | 0.0012 | Inf | 0.0012 | 1 | 1 | laurate hydroxylase activity |
GO:0103002 | 0.0012 | Inf | 0.0012 | 1 | 1 | 16-hydroxypalmitate dehydrogenase activity |
GO:0017171 | 0.0012 | 16.6988 | 0.2142 | 3 | 185 | serine hydrolase activity |
GO:0005549 | 0.0022 | 32.5663 | 0.0706 | 2 | 61 | odorant binding |
GO:0140625 | 0.0023 | 910.5556 | 0.0023 | 1 | 2 | opioid growth factor receptor activity |
GO:0018858 | 0.0035 | 455.25 | 0.0035 | 1 | 3 | benzoate-CoA ligase activity |
GO:0050051 | 0.0046 | 303.4815 | 0.0046 | 1 | 4 | leukotriene-B4 20-monooxygenase activity |
GO:0102391 | 0.0046 | 303.4815 | 0.0046 | 1 | 4 | decanoate-CoA ligase activity |
GO:0004321 | 0.0081 | 151.713 | 0.0081 | 1 | 7 | fatty-acyl-CoA synthase activity |
GO:0020037 | 0.009 | 15.56 | 0.1447 | 2 | 125 | heme binding |
GOMFID | Pvalue | OddsRatio | ExpCount | Count | Size | Term |
GO:0004984 | 0 | 80.92 | 0.3375 | 13 | 213 | olfactory receptor activity |
GO:0004930 | 0 | 31.4522 | 0.9506 | 14 | 600 | G protein-coupled receptor activity |
GO:0038023 | 0 | 20.5405 | 1.9013 | 16 | 1200 | signaling receptor activity |
GO:0005549 | 0 | 69.4218 | 0.0966 | 5 | 61 | odorant binding |
GO:0018685 | 0 | 1365.25 | 0.0048 | 2 | 3 | alkane 1-monooxygenase activity |
GO:0102033 | 0 | 341.25 | 0.0095 | 2 | 6 | long-chain fatty acid omega-hydroxylase activity |
GO:0008391 | 3e-04 | 90.9389 | 0.0269 | 2 | 17 | arachidonic acid monooxygenase activity |
GO:0102116 | 0.0016 | Inf | 0.0016 | 1 | 1 | laurate hydroxylase activity |
GO:0103002 | 0.0016 | Inf | 0.0016 | 1 | 1 | 16-hydroxypalmitate dehydrogenase activity |
GO:0004252 | 0.0022 | 13.1431 | 0.2598 | 3 | 164 | serine-type endopeptidase activity |
GO:0017171 | 0.003 | 11.6116 | 0.2931 | 3 | 185 | serine hydrolase activity |
GO:0050051 | 0.0063 | 218.4133 | 0.0063 | 1 | 4 | leukotriene-B4 20-monooxygenase activity |
GO:0030883 | 0.0079 | 163.8 | 0.0079 | 1 | 5 | endogenous lipid antigen binding |
GO:0030884 | 0.0079 | 163.8 | 0.0079 | 1 | 5 | exogenous lipid antigen binding |
GO:0005132 | 0.0095 | 131.032 | 0.0095 | 1 | 6 | type I interferon receptor binding |
GO:0032395 | 0.0095 | 131.032 | 0.0095 | 1 | 6 | MHC class II receptor activity |
GOMFID | Pvalue | OddsRatio | ExpCount | Count | Size | Term |
GO:0004984 | 0 | 36.6583 | 0.2856 | 7 | 213 | olfactory receptor activity |
GO:0004930 | 0 | 15.2471 | 0.8044 | 8 | 600 | G protein-coupled receptor activity |
GO:0005549 | 0 | 63.6686 | 0.0818 | 4 | 61 | odorant binding |
GO:0038023 | 1e-04 | 7.2848 | 1.6088 | 8 | 1200 | signaling receptor activity |
GO:0008389 | 0.0013 | Inf | 0.0013 | 1 | 1 | coumarin 7-hydroxylase activity |
GO:0001632 | 0.0027 | 780.3333 | 0.0027 | 1 | 2 | leukotriene B4 receptor activity |
GOMFID | Pvalue | OddsRatio | ExpCount | Count | Size | Term |
GO:0046982 | 0 | 39.3811 | 0.6216 | 14 | 300 | protein heterodimerization activity |
GO:0019904 | 0 | 17.438 | 1.3385 | 14 | 646 | protein domain specific binding |
GO:0003723 | 0 | 10.0472 | 3.4539 | 18 | 1667 | RNA binding |
GO:0003677 | 0 | 5.4649 | 4.7799 | 16 | 2307 | DNA binding |
GO:0004984 | 0 | 16.7381 | 0.4413 | 6 | 213 | olfactory receptor activity |
GO:0005549 | 3e-04 | 27.2269 | 0.1264 | 3 | 61 | odorant binding |
GO:1901363 | 0.001 | 3.0816 | 11.7125 | 21 | 5653 | heterocyclic compound binding |
GO:0097159 | 0.0012 | 3.0223 | 11.8617 | 21 | 5725 | organic cyclic compound binding |
GO:0004930 | 0.0013 | 5.6934 | 1.2431 | 6 | 600 | G protein-coupled receptor activity |
GO:1903231 | 0.0025 | 12.1883 | 0.2735 | 3 | 132 | mRNA base-pairing post-transcriptional repressor activity |
GO:0106386 | 0.0041 | 496.2121 | 0.0041 | 1 | 2 | (3R)-hydroxyacyl-CoA dehydrogenase (NAD) activity |
GO:0008426 | 0.0062 | 248.0909 | 0.0062 | 1 | 3 | protein kinase C inhibitor activity |
GO:0070404 | 0.0062 | 248.0909 | 0.0062 | 1 | 3 | NADH binding |
GOMFID | Pvalue | OddsRatio | ExpCount | Count | Size | Term |
GO:0046982 | 0 | 71.6421 | 0.457 | 14 | 300 | protein heterodimerization activity |
GO:0019904 | 0 | 31.7235 | 0.9842 | 14 | 646 | protein domain specific binding |
GO:0003723 | 0 | 13.3774 | 2.5396 | 15 | 1667 | RNA binding |
GO:0003677 | 0 | 10.9367 | 3.5146 | 16 | 2307 | DNA binding |
GO:0008308 | 2e-04 | 109.5117 | 0.0229 | 2 | 15 | voltage-gated anion channel activity |
GO:1901363 | 6e-04 | 4.0528 | 8.6121 | 17 | 5653 | heterocyclic compound binding |
GO:0097159 | 8e-04 | 3.9749 | 8.7218 | 17 | 5725 | organic cyclic compound binding |
GOMFID | Pvalue | OddsRatio | ExpCount | Count | Size | Term |
GO:0046982 | 0 | 56.4737 | 0.5484 | 15 | 300 | protein heterodimerization activity |
GO:0019904 | 0 | 21.803 | 1.181 | 14 | 646 | protein domain specific binding |
GO:0003723 | 0 | 10.1957 | 3.0475 | 16 | 1667 | RNA binding |
GO:0003677 | 0 | 9.2339 | 4.2176 | 18 | 2307 | DNA binding |
GO:1901363 | 3e-04 | 3.8157 | 10.3346 | 20 | 5653 | heterocyclic compound binding |
GO:0097159 | 4e-04 | 3.7423 | 10.4662 | 20 | 5725 | organic cyclic compound binding |
GO:0031707 | 0.0018 | Inf | 0.0018 | 1 | 1 | endothelin A receptor binding |
GO:0008426 | 0.0055 | 282.3793 | 0.0055 | 1 | 3 | protein kinase C inhibitor activity |
GO:0031708 | 0.0055 | 282.3793 | 0.0055 | 1 | 3 | endothelin B receptor binding |
NA. |
n/a |
NA. |
n/a |
NA. |
n/a |
NA. |
n/a |
NA. |
n/a |
NA. |
n/a |
NA. |
n/a |
NA. |
n/a |
NA. |
n/a |
NA. |
n/a |
NA. |
n/a |
NA. |
n/a |
NA. |
n/a |
NA. |
n/a |
NA. |
n/a |
NA. |
n/a |
NA. |
n/a |
NA. |
n/a |
NA. |
n/a |
NA. |
n/a |
NA. |
n/a |
NA. |
n/a |
NA. |
n/a |
NA. |
n/a |
NA. |
n/a |
NA. |
n/a |
NA. |
n/a |
NA. |
n/a |
NA. |
n/a |
NA. |
n/a |
NA. |
n/a |
NA. |
n/a |
NA. |
n/a |
NA. |
n/a |
NA. |
n/a |
NA. |
n/a |
NA. |
n/a |
NA. |
n/a |
NA. |
n/a |
NA. |
n/a |
NA. |
n/a |
NA. |
n/a |
NA. |
n/a |
NA. |
n/a |
NA. |
n/a |
NA. |
n/a |
NA. |
n/a |
NA. |
n/a |
NA. |
n/a |
NA. |
n/a |
NA. |
n/a |
NA. |
n/a |
NA. |
n/a |
NA. |
n/a |
NA. |
n/a |
NA. |
n/a |
NA. |
n/a |
NA. |
n/a |
NA. |
n/a |
NA. |
n/a |
NA. |
n/a |
NA. |
n/a |
NA. |
n/a |
NA. |
n/a |
GOMFID | Pvalue | OddsRatio | ExpCount | Count | Size | Term |
GO:0006335 | 0 | 288.5185 | 0.0699 | 10 | 31 | DNA replication-dependent chromatin assembly |
GO:0006334 | 0 | 63.4893 | 0.2366 | 10 | 105 | nucleosome assembly |
GO:0040029 | 0 | 49.3564 | 0.2975 | 10 | 132 | regulation of gene expression, epigenetic |
GO:0032200 | 0 | 42.0539 | 0.3448 | 10 | 153 | telomere organization |
GO:0071824 | 0 | 29.963 | 0.4733 | 10 | 210 | protein-DNA complex subunit organization |
GO:0006338 | 0 | 26.4733 | 0.5319 | 10 | 236 | chromatin remodeling |
GO:0050911 | 0 | 11.0887 | 0.6468 | 6 | 287 | detection of chemical stimulus involved in sensory perception of smell |
GO:0009593 | 1e-04 | 8.7622 | 0.8114 | 6 | 360 | detection of chemical stimulus |
GO:0065003 | 1e-04 | 4.7224 | 3.0857 | 11 | 1407 | protein-containing complex assembly |
GO:0007606 | 2e-04 | 8.4685 | 0.8384 | 6 | 372 | sensory perception of chemical stimulus |
GO:1903244 | 2e-04 | 133.6571 | 0.0203 | 2 | 9 | positive regulation of cardiac muscle hypertrophy in response to stress |
GO:0050906 | 2e-04 | 8.1935 | 0.8654 | 6 | 384 | detection of stimulus involved in sensory perception |
GO:1905205 | 2e-04 | 116.9429 | 0.0225 | 2 | 10 | positive regulation of connective tissue replacement |
GO:0014744 | 4e-04 | 77.9429 | 0.0316 | 2 | 14 | positive regulation of muscle adaptation |
GO:0010612 | 7e-04 | 58.4429 | 0.0406 | 2 | 18 | regulation of cardiac muscle adaptation |
GO:0050789 | 9e-04 | 4.3924 | 24.1648 | 33 | 10722 | regulation of biological process |
GO:1903671 | 0.0016 | 38.9429 | 0.0586 | 2 | 26 | negative regulation of sprouting angiogenesis |
GO:0050877 | 0.0017 | 3.8308 | 2.8781 | 9 | 1277 | nervous system process |
GO:0003299 | 0.0022 | 32.2187 | 0.0699 | 2 | 31 | muscle hypertrophy in response to stress |
GO:0097275 | 0.0023 | Inf | 0.0023 | 1 | 1 | cellular ammonium homeostasis |
GO:0097276 | 0.0023 | Inf | 0.0023 | 1 | 1 | cellular creatinine homeostasis |
GO:0097277 | 0.0023 | Inf | 0.0023 | 1 | 1 | cellular urea homeostasis |
GO:0014742 | 0.003 | 27.4723 | 0.0811 | 2 | 36 | positive regulation of muscle hypertrophy |
GO:0010467 | 0.0042 | 2.5227 | 13.6217 | 22 | 6044 | gene expression |
GO:1904270 | 0.0045 | 454.9722 | 0.0045 | 1 | 2 | pyroptosome complex assembly |
GO:0051898 | 0.0063 | 18.2958 | 0.1194 | 2 | 53 | negative regulation of protein kinase B signaling |
GO:0014888 | 0.0066 | 17.9429 | 0.1217 | 2 | 54 | striated muscle adaptation |
GO:1904059 | 0.0067 | 227.4722 | 0.0068 | 1 | 3 | regulation of locomotor rhythm |
GO:0060255 | 0.008 | 2.3369 | 13.3242 | 21 | 5912 | regulation of macromolecule metabolic process |
GO:0007186 | 0.0081 | 3.4311 | 2.3664 | 7 | 1050 | G protein-coupled receptor signaling pathway |
GO:0044085 | 0.0089 | 2.5073 | 6.5877 | 13 | 2923 | cellular component biogenesis |
GO:0010611 | 0.0097 | 14.5679 | 0.1487 | 2 | 66 | regulation of cardiac muscle hypertrophy |
GOMFID | Pvalue | OddsRatio | ExpCount | Count | Size | Term |
GO:0048252 | 0 | Inf | 0.0026 | 2 | 2 | lauric acid metabolic process |
GO:0019373 | 2e-04 | 107.7632 | 0.023 | 2 | 18 | epoxygenase P450 pathway |
GO:0043651 | 2e-04 | 107.7632 | 0.023 | 2 | 18 | linoleic acid metabolic process |
GO:0050911 | 4e-04 | 13.3968 | 0.3671 | 4 | 287 | detection of chemical stimulus involved in sensory perception of smell |
GO:0009593 | 0.001 | 10.6015 | 0.4605 | 4 | 360 | detection of chemical stimulus |
GO:0007606 | 0.0011 | 10.2481 | 0.4758 | 4 | 372 | sensory perception of chemical stimulus |
GO:0050906 | 0.0013 | 9.917 | 0.4912 | 4 | 384 | detection of stimulus involved in sensory perception |
GO:0046456 | 0.002 | 34.4126 | 0.0665 | 2 | 52 | icosanoid biosynthetic process |
GO:0001519 | 0.0026 | 819.75 | 0.0026 | 1 | 2 | peptide amidation |
GO:0031408 | 0.0026 | 819.75 | 0.0026 | 1 | 2 | oxylipin biosynthetic process |
GO:0032827 | 0.0026 | 819.75 | 0.0026 | 1 | 2 | negative regulation of natural killer cell differentiation involved in immune response |
GO:0097214 | 0.0026 | 819.75 | 0.0026 | 1 | 2 | positive regulation of lysosomal membrane permeability |
GO:2000296 | 0.0026 | 819.75 | 0.0026 | 1 | 2 | negative regulation of hydrogen peroxide catabolic process |
GO:2000376 | 0.0026 | 819.75 | 0.0026 | 1 | 2 | positive regulation of oxygen metabolic process |
GO:0003095 | 0.0038 | 409.85 | 0.0038 | 1 | 3 | pressure natriuresis |
GO:0031914 | 0.0038 | 409.85 | 0.0038 | 1 | 3 | negative regulation of synaptic plasticity |
GO:0055073 | 0.0038 | 409.85 | 0.0038 | 1 | 3 | cadmium ion homeostasis |
GO:0061789 | 0.0038 | 409.85 | 0.0038 | 1 | 3 | dense core granule priming |
GO:0033559 | 0.0044 | 22.8235 | 0.0996 | 2 | 86 | unsaturated fatty acid metabolic process |
GO:0032787 | 0.0048 | 6.7918 | 0.7074 | 4 | 553 | monocarboxylic acid metabolic process |
GO:0003073 | 0.0051 | 20.9422 | 0.1074 | 2 | 84 | regulation of systemic arterial blood pressure |
GO:0001822 | 0.0054 | 9.5581 | 0.3633 | 3 | 284 | kidney development |
GO:0016053 | 0.0057 | 9.3548 | 0.371 | 3 | 290 | organic acid biosynthetic process |
GO:0044255 | 0.0058 | 5.1616 | 1.2037 | 5 | 941 | cellular lipid metabolic process |
GO:0036091 | 0.0064 | 204.9 | 0.0064 | 1 | 5 | positive regulation of transcription from RNA polymerase II promoter in response to oxidative stress |
GO:0036101 | 0.0064 | 204.9 | 0.0064 | 1 | 5 | leukotriene B4 catabolic process |
GO:0097212 | 0.0064 | 204.9 | 0.0064 | 1 | 5 | lysosomal membrane organization |
GO:0099525 | 0.0064 | 204.9 | 0.0064 | 1 | 5 | presynaptic dense core vesicle exocytosis |
GO:0002249 | 0.0077 | 163.91 | 0.0077 | 1 | 6 | lymphocyte anergy |
GO:0002667 | 0.0077 | 163.91 | 0.0077 | 1 | 6 | regulation of T cell anergy |
GO:0009253 | 0.0077 | 163.91 | 0.0077 | 1 | 6 | peptidoglycan catabolic process |
GO:0001655 | 0.0083 | 8.1646 | 0.4234 | 3 | 331 | urogenital system development |
GO:0002933 | 0.0089 | 136.5833 | 0.009 | 1 | 7 | lipid hydroxylation |
GO:0009804 | 0.0089 | 136.5833 | 0.009 | 1 | 7 | coumarin metabolic process |
GO:0046222 | 0.0089 | 136.5833 | 0.009 | 1 | 7 | aflatoxin metabolic process |
GOMFID | Pvalue | OddsRatio | ExpCount | Count | Size | Term |
GO:0040011 | 0 | 5.3538 | 4.9679 | 18 | 1773 | locomotion |
GO:0051674 | 0 | 5.1183 | 4.4106 | 16 | 1609 | localization of cell |
GO:0006928 | 0 | 4.6298 | 5.6432 | 18 | 2014 | movement of cell or subcellular component |
GO:0022008 | 1e-04 | 4.2499 | 4.3206 | 14 | 1542 | neurogenesis |
GO:0048665 | 1e-04 | 42.2326 | 0.0841 | 3 | 30 | neuron fate specification |
GO:0072009 | 2e-04 | 16.1458 | 0.2802 | 4 | 100 | nephron epithelium development |
GO:0048513 | 2e-04 | 3.1575 | 9.042 | 20 | 3227 | animal organ development |
GO:1903244 | 3e-04 | 106.2597 | 0.0252 | 2 | 9 | positive regulation of cardiac muscle hypertrophy in response to stress |
GO:1905205 | 3e-04 | 92.9716 | 0.028 | 2 | 10 | positive regulation of connective tissue replacement |
GO:0031589 | 4e-04 | 7.1803 | 0.9555 | 6 | 341 | cell-substrate adhesion |
GO:2000179 | 4e-04 | 24.2316 | 0.1401 | 3 | 50 | positive regulation of neural precursor cell proliferation |
GO:0051898 | 4e-04 | 22.7735 | 0.1485 | 3 | 53 | negative regulation of protein kinase B signaling |
GO:0048731 | 5e-04 | 3.7203 | 5.6356 | 14 | 2752 | system development |
GO:0010273 | 6e-04 | 67.6033 | 0.0364 | 2 | 13 | detoxification of copper ion |
GO:0014744 | 7e-04 | 61.9659 | 0.0392 | 2 | 14 | positive regulation of muscle adaptation |
GO:0001568 | 8e-04 | 4.6098 | 2.0258 | 8 | 723 | blood vessel development |
GO:0050789 | 9e-04 | 3.5505 | 30.0428 | 40 | 10722 | regulation of biological process |
GO:0072078 | 9e-04 | 17.7765 | 0.1877 | 3 | 67 | nephron tubule morphogenesis |
GO:0072359 | 9e-04 | 3.8228 | 3.1354 | 10 | 1119 | circulatory system development |
GO:0007379 | 9e-04 | 53.1071 | 0.0448 | 2 | 16 | segment specification |
GO:0032095 | 9e-04 | 53.1071 | 0.0448 | 2 | 16 | regulation of response to food |
GO:0097501 | 0.001 | 49.5636 | 0.0476 | 2 | 17 | stress response to metal ion |
GO:0048523 | 0.001 | 2.6299 | 12.7013 | 23 | 4533 | negative regulation of cellular process |
GO:0021953 | 0.0011 | 9.8356 | 0.4511 | 4 | 161 | central nervous system neuron differentiation |
GO:0072028 | 0.0011 | 16.4833 | 0.2017 | 3 | 72 | nephron morphogenesis |
GO:0003159 | 0.0011 | 46.4631 | 0.0504 | 2 | 18 | morphogenesis of an endothelium |
GO:0010612 | 0.0011 | 46.4631 | 0.0504 | 2 | 18 | regulation of cardiac muscle adaptation |
GO:0048729 | 0.0012 | 4.852 | 1.656 | 7 | 591 | tissue morphogenesis |
GO:0071294 | 0.0014 | 41.2955 | 0.056 | 2 | 20 | cellular response to zinc ion |
GO:0001667 | 0.0014 | 5.4565 | 1.2441 | 6 | 444 | ameboidal-type cell migration |
GO:0001656 | 0.0016 | 14.2073 | 0.2326 | 3 | 83 | metanephros development |
GO:0060562 | 0.0017 | 6.4238 | 0.8686 | 5 | 310 | epithelial tube morphogenesis |
GO:0061326 | 0.0017 | 13.859 | 0.2382 | 3 | 85 | renal tubule development |
GO:0021871 | 0.0019 | 35.3896 | 0.0644 | 2 | 23 | forebrain regionalization |
GO:0071363 | 0.0019 | 4.4479 | 1.7989 | 7 | 642 | cellular response to growth factor stimulus |
GO:0071495 | 0.0021 | 3.3837 | 3.5081 | 10 | 1252 | cellular response to endogenous stimulus |
GO:0032104 | 0.0022 | 32.3083 | 0.07 | 2 | 25 | regulation of response to extracellular stimulus |
GO:0071280 | 0.0022 | 32.3083 | 0.07 | 2 | 25 | cellular response to copper ion |
GO:0001655 | 0.0023 | 6.0022 | 0.9275 | 5 | 331 | urogenital system development |
GO:0090132 | 0.0023 | 5.9463 | 0.9359 | 5 | 334 | epithelium migration |
GO:1903671 | 0.0024 | 30.9602 | 0.0729 | 2 | 26 | negative regulation of sprouting angiogenesis |
GO:0048869 | 0.0024 | 2.6091 | 9.4 | 18 | 3617 | cellular developmental process |
GO:0003008 | 0.0027 | 2.8404 | 5.6236 | 13 | 2007 | system process |
GO:0097476 | 0.0027 | Inf | 0.0027 | 1 | 1 | spinal cord motor neuron migration |
GO:0032903 | 0.0028 | Inf | 0.0028 | 1 | 1 | regulation of nerve growth factor production |
GO:0035847 | 0.0028 | Inf | 0.0028 | 1 | 1 | uterine epithelium development |
GO:0035849 | 0.0028 | Inf | 0.0028 | 1 | 1 | nephric duct elongation |
GO:0035852 | 0.0028 | Inf | 0.0028 | 1 | 1 | horizontal cell localization |
GO:0045720 | 0.0028 | Inf | 0.0028 | 1 | 1 | negative regulation of integrin biosynthetic process |
GO:0048572 | 0.0028 | Inf | 0.0028 | 1 | 1 | short-day photoperiodism |
GO:0060945 | 0.0028 | Inf | 0.0028 | 1 | 1 | cardiac neuron differentiation |
GO:0070208 | 0.0028 | Inf | 0.0028 | 1 | 1 | protein heterotrimerization |
GO:0090138 | 0.0028 | Inf | 0.0028 | 1 | 1 | regulation of actin cytoskeleton organization by cell-cell adhesion |
GO:0097379 | 0.0028 | Inf | 0.0028 | 1 | 1 | dorsal spinal cord interneuron posterior axon guidance |
GO:1902203 | 0.0028 | Inf | 0.0028 | 1 | 1 | negative regulation of hepatocyte growth factor receptor signaling pathway |
GO:1902870 | 0.0028 | Inf | 0.0028 | 1 | 1 | negative regulation of amacrine cell differentiation |
GO:1903056 | 0.0028 | Inf | 0.0028 | 1 | 1 | regulation of melanosome organization |
GO:2000744 | 0.0028 | Inf | 0.0028 | 1 | 1 | positive regulation of anterior head development |
GO:2001113 | 0.0028 | Inf | 0.0028 | 1 | 1 | negative regulation of cellular response to hepatocyte growth factor stimulus |
GO:0035239 | 0.0028 | 4.7644 | 1.4356 | 6 | 564 | tube morphogenesis |
GO:0032501 | 0.003 | 2.9881 | 8.4761 | 16 | 4006 | multicellular organismal process |
GO:0016477 | 0.0032 | 4.1193 | 1.9952 | 7 | 854 | cell migration |
GO:0021987 | 0.0032 | 11.0192 | 0.297 | 3 | 106 | cerebral cortex development |
GO:0003299 | 0.0034 | 25.6144 | 0.0869 | 2 | 31 | muscle hypertrophy in response to stress |
GO:1903507 | 0.0037 | 3.2964 | 3.1774 | 9 | 1134 | negative regulation of nucleic acid-templated transcription |
GO:0048646 | 0.0038 | 3.2933 | 3.1802 | 9 | 1135 | anatomical structure formation involved in morphogenesis |
GO:0071276 | 0.0038 | 23.9589 | 0.0925 | 2 | 33 | cellular response to cadmium ion |
GO:0021537 | 0.0042 | 6.6543 | 0.6585 | 4 | 235 | telencephalon development |
GO:0014742 | 0.0046 | 21.8409 | 0.1009 | 2 | 36 | positive regulation of muscle hypertrophy |
GO:0090051 | 0.0046 | 21.8409 | 0.1009 | 2 | 36 | negative regulation of cell migration involved in sprouting angiogenesis |
GO:0006882 | 0.0048 | 21.2156 | 0.1037 | 2 | 37 | cellular zinc ion homeostasis |
GO:2000145 | 0.0049 | 3.3984 | 2.6983 | 8 | 963 | regulation of cell motility |
GO:0120035 | 0.0054 | 4.1133 | 1.6307 | 6 | 582 | regulation of plasma membrane bounded cell projection organization |
GO:0046370 | 0.0056 | 363.7778 | 0.0056 | 1 | 2 | fructose biosynthetic process |
GO:0060067 | 0.0056 | 363.7778 | 0.0056 | 1 | 2 | cervix development |
GO:0072272 | 0.0056 | 363.7778 | 0.0056 | 1 | 2 | proximal/distal pattern formation involved in metanephric nephron development |
GO:0097214 | 0.0056 | 363.7778 | 0.0056 | 1 | 2 | positive regulation of lysosomal membrane permeability |
GO:0097324 | 0.0056 | 363.7778 | 0.0056 | 1 | 2 | melanocyte migration |
GO:0097498 | 0.0056 | 363.7778 | 0.0056 | 1 | 2 | endothelial tube lumen extension |
GO:0140039 | 0.0056 | 363.7778 | 0.0056 | 1 | 2 | cell-cell adhesion in response to extracellular stimulus |
GO:2000296 | 0.0056 | 363.7778 | 0.0056 | 1 | 2 | negative regulation of hydrogen peroxide catabolic process |
GO:2000376 | 0.0056 | 363.7778 | 0.0056 | 1 | 2 | positive regulation of oxygen metabolic process |
GO:2000768 | 0.0056 | 363.7778 | 0.0056 | 1 | 2 | positive regulation of nephron tubule epithelial cell differentiation |
GO:0045165 | 0.0056 | 6.0918 | 0.7173 | 4 | 256 | cell fate commitment |
GO:0043542 | 0.0058 | 6.0431 | 0.7229 | 4 | 258 | endothelial cell migration |
GO:2000181 | 0.0059 | 8.8534 | 0.3671 | 3 | 131 | negative regulation of blood vessel morphogenesis |
GO:0030182 | 0.006 | 3.3115 | 2.8098 | 8 | 1114 | neuron differentiation |
GO:0098754 | 0.006 | 8.7842 | 0.3699 | 3 | 132 | detoxification |
GO:0035850 | 0.0062 | 18.558 | 0.1177 | 2 | 42 | epithelial cell differentiation involved in kidney development |
GO:0051241 | 0.0062 | 3.257 | 2.8156 | 8 | 1027 | negative regulation of multicellular organismal process |
GO:0043535 | 0.0064 | 8.583 | 0.3783 | 3 | 135 | regulation of blood vessel endothelial cell migration |
GO:0051253 | 0.0065 | 3.0075 | 3.4576 | 9 | 1234 | negative regulation of RNA metabolic process |
GO:0010632 | 0.0067 | 5.7883 | 0.7537 | 4 | 269 | regulation of epithelial cell migration |
GO:0002040 | 0.0069 | 8.3502 | 0.3892 | 3 | 145 | sprouting angiogenesis |
GO:0021517 | 0.007 | 17.26 | 0.1261 | 2 | 45 | ventral spinal cord development |
GO:0050770 | 0.007 | 8.2672 | 0.3923 | 3 | 140 | regulation of axonogenesis |
GO:0009890 | 0.0072 | 2.7969 | 4.1721 | 10 | 1489 | negative regulation of biosynthetic process |
GO:0070887 | 0.0075 | 2.3584 | 7.8511 | 15 | 2802 | cellular response to chemical stimulus |
GO:0061564 | 0.0075 | 4.4676 | 1.2329 | 5 | 440 | axon development |
GO:0060041 | 0.0078 | 7.9736 | 0.4063 | 3 | 145 | retina development in camera-type eye |
GO:0000122 | 0.008 | 3.3822 | 2.3312 | 7 | 832 | negative regulation of transcription by RNA polymerase II |
GO:0032502 | 0.0081 | 3.856 | 2.5036 | 7 | 1608 | developmental process |
GO:0001705 | 0.0084 | 181.8778 | 0.0084 | 1 | 3 | ectoderm formation |
GO:0033624 | 0.0084 | 181.8778 | 0.0084 | 1 | 3 | negative regulation of integrin activation |
GO:0055073 | 0.0084 | 181.8778 | 0.0084 | 1 | 3 | cadmium ion homeostasis |
GO:0060164 | 0.0084 | 181.8778 | 0.0084 | 1 | 3 | regulation of timing of neuron differentiation |
GO:0097377 | 0.0084 | 181.8778 | 0.0084 | 1 | 3 | spinal cord interneuron axon guidance |
GO:0097477 | 0.0084 | 181.8778 | 0.0084 | 1 | 3 | lateral motor column neuron migration |
GO:1904178 | 0.0084 | 181.8778 | 0.0084 | 1 | 3 | negative regulation of adipose tissue development |
GO:0030198 | 0.0084 | 5.4141 | 0.8042 | 4 | 287 | extracellular matrix organization |
GO:2000026 | 0.0084 | 2.8776 | 3.6005 | 9 | 1285 | regulation of multicellular organismal development |
GO:0051093 | 0.0085 | 3.3466 | 2.3605 | 7 | 861 | negative regulation of developmental process |
GO:0021515 | 0.0086 | 15.4574 | 0.1401 | 2 | 50 | cell differentiation in spinal cord |
GO:0001764 | 0.0091 | 7.4942 | 0.4315 | 3 | 154 | neuron migration |
GO:0001658 | 0.0093 | 14.8373 | 0.1457 | 2 | 52 | branching involved in ureteric bud morphogenesis |
GO:0008015 | 0.0099 | 4.1623 | 1.3197 | 5 | 471 | blood circulation |
GO:0000904 | 0.01 | 3.5934 | 1.8549 | 6 | 662 | cell morphogenesis involved in differentiation |
GOMFID | Pvalue | OddsRatio | ExpCount | Count | Size | Term |
GO:0051674 | 0 | 5.7315 | 3.3343 | 13 | 1610 | localization of cell |
GO:0045165 | 0 | 13.8283 | 0.5302 | 6 | 256 | cell fate commitment |
GO:0040011 | 0 | 5.1434 | 3.6719 | 13 | 1773 | locomotion |
GO:0006928 | 1e-04 | 4.4493 | 4.171 | 13 | 2014 | movement of cell or subcellular component |
GO:2000179 | 1e-04 | 33.6362 | 0.1036 | 3 | 50 | positive regulation of neural precursor cell proliferation |
GO:0061180 | 3e-04 | 25.475 | 0.1346 | 3 | 65 | mammary gland epithelium development |
GO:0048468 | 4e-04 | 4.0231 | 4.0758 | 12 | 1968 | cell development |
GO:0032989 | 5e-04 | 5.8172 | 1.4621 | 7 | 706 | cellular component morphogenesis |
GO:0032501 | 5e-04 | 3.64 | 12.4726 | 22 | 6530 | multicellular organismal process |
GO:0090132 | 6e-04 | 8.4132 | 0.6917 | 5 | 334 | epithelium migration |
GO:0022008 | 8e-04 | 4.0391 | 3.1935 | 10 | 1542 | neurogenesis |
GO:0052652 | 9e-04 | 53.8289 | 0.0435 | 2 | 21 | cyclic purine nucleotide metabolic process |
GO:0061042 | 9e-04 | 53.8289 | 0.0435 | 2 | 21 | vascular wound healing |
GO:0001759 | 0.001 | 48.6964 | 0.0476 | 2 | 23 | organ induction |
GO:0035295 | 0.0011 | 4.5069 | 2.1849 | 8 | 1055 | tube development |
GO:0016477 | 0.0012 | 5.0912 | 1.7154 | 7 | 942 | cell migration |
GO:0042060 | 0.0013 | 7.015 | 0.8243 | 5 | 398 | wound healing |
GO:0003018 | 0.0016 | 8.9306 | 0.5074 | 4 | 245 | vascular process in circulatory system |
GO:0048665 | 0.0017 | 36.5067 | 0.0621 | 2 | 30 | neuron fate specification |
GO:0021988 | 0.0019 | 35.2457 | 0.0642 | 2 | 31 | olfactory lobe development |
GO:0043542 | 0.0019 | 8.4667 | 0.5343 | 4 | 258 | endothelial cell migration |
GO:0048514 | 0.002 | 5.2286 | 1.3482 | 6 | 651 | blood vessel morphogenesis |
GO:0001667 | 0.0021 | 6.2619 | 0.9195 | 5 | 444 | ameboidal-type cell migration |
GO:0014843 | 0.0021 | Inf | 0.0021 | 1 | 1 | growth factor dependent regulation of skeletal muscle satellite cell proliferation |
GO:0060945 | 0.0021 | Inf | 0.0021 | 1 | 1 | cardiac neuron differentiation |
GO:1902748 | 0.0021 | Inf | 0.0021 | 1 | 1 | positive regulation of lens fiber cell differentiation |
GO:0090050 | 0.0021 | 32.9677 | 0.0683 | 2 | 33 | positive regulation of cell migration involved in sprouting angiogenesis |
GO:0071312 | 0.0024 | 30.9659 | 0.0725 | 2 | 35 | cellular response to alkaloid |
GO:0072001 | 0.0026 | 7.7895 | 0.5811 | 4 | 289 | renal system development |
GO:0019932 | 0.0027 | 7.6961 | 0.5861 | 4 | 283 | second-messenger-mediated signaling |
GO:0070887 | 0.0027 | 3.0173 | 5.803 | 13 | 2802 | cellular response to chemical stimulus |
GO:0043535 | 0.0027 | 11.9142 | 0.2796 | 3 | 135 | regulation of blood vessel endothelial cell migration |
GO:0007420 | 0.0028 | 4.8662 | 1.4435 | 6 | 697 | brain development |
GO:0009187 | 0.0028 | 28.3802 | 0.0787 | 2 | 38 | cyclic nucleotide metabolic process |
GO:0048754 | 0.0031 | 11.3094 | 0.2941 | 3 | 142 | branching morphogenesis of an epithelial tube |
GO:2000145 | 0.0031 | 4.1837 | 1.9944 | 7 | 963 | regulation of cell motility |
GO:0021795 | 0.0034 | 25.5359 | 0.087 | 2 | 42 | cerebral cortex cell migration |
GO:1904707 | 0.0036 | 24.9116 | 0.0891 | 2 | 43 | positive regulation of vascular associated smooth muscle cell proliferation |
GO:0007568 | 0.0036 | 10.6886 | 0.3107 | 3 | 150 | aging |
GO:0048646 | 0.004 | 4.0112 | 2.0976 | 7 | 1072 | anatomical structure formation involved in morphogenesis |
GO:0014809 | 0.0041 | 496.4242 | 0.0041 | 1 | 2 | regulation of skeletal muscle contraction by regulation of release of sequestered calcium ion |
GO:0021823 | 0.0041 | 496.4242 | 0.0041 | 1 | 2 | cerebral cortex tangential migration using cell-cell interactions |
GO:0021836 | 0.0041 | 496.4242 | 0.0041 | 1 | 2 | chemorepulsion involved in postnatal olfactory bulb interneuron migration |
GO:0042660 | 0.0041 | 496.4242 | 0.0041 | 1 | 2 | positive regulation of cell fate specification |
GO:0046370 | 0.0041 | 496.4242 | 0.0041 | 1 | 2 | fructose biosynthetic process |
GO:0048343 | 0.0041 | 496.4242 | 0.0041 | 1 | 2 | paraxial mesodermal cell fate commitment |
GO:0050925 | 0.0041 | 496.4242 | 0.0041 | 1 | 2 | negative regulation of negative chemotaxis |
GO:0140039 | 0.0041 | 496.4242 | 0.0041 | 1 | 2 | cell-cell adhesion in response to extracellular stimulus |
GO:1902257 | 0.0041 | 496.4242 | 0.0041 | 1 | 2 | negative regulation of apoptotic process involved in outflow tract morphogenesis |
GO:0001944 | 0.0042 | 4.4603 | 1.5678 | 6 | 757 | vasculature development |
GO:0021872 | 0.0042 | 22.6917 | 0.0973 | 2 | 47 | forebrain generation of neurons |
GO:0006950 | 0.0043 | 3.5168 | 3.4116 | 9 | 1958 | response to stress |
GO:0021543 | 0.0044 | 9.9377 | 0.3334 | 3 | 161 | pallium development |
GO:0021953 | 0.0044 | 9.9377 | 0.3334 | 3 | 161 | central nervous system neuron differentiation |
GO:0010634 | 0.0047 | 9.7508 | 0.3396 | 3 | 164 | positive regulation of epithelial cell migration |
GO:0002042 | 0.0048 | 21.3085 | 0.1035 | 2 | 53 | cell migration involved in sprouting angiogenesis |
GO:0007566 | 0.0048 | 21.2695 | 0.1036 | 2 | 50 | embryo implantation |
GO:2001258 | 0.0048 | 21.2695 | 0.1036 | 2 | 50 | negative regulation of cation channel activity |
GO:0003002 | 0.005 | 6.4264 | 0.6979 | 4 | 337 | regionalization |
GO:0061005 | 0.005 | 20.8342 | 0.1056 | 2 | 51 | cell differentiation involved in kidney development |
GO:0006749 | 0.0052 | 20.4163 | 0.1077 | 2 | 52 | glutathione metabolic process |
GO:0072132 | 0.0054 | 20.0147 | 0.1098 | 2 | 53 | mesenchyme morphogenesis |
GO:1904645 | 0.0054 | 20.0147 | 0.1098 | 2 | 53 | response to amyloid-beta |
GO:0045766 | 0.0055 | 9.1749 | 0.3604 | 3 | 174 | positive regulation of angiogenesis |
GO:0060038 | 0.0056 | 19.6286 | 0.1118 | 2 | 54 | cardiac muscle cell proliferation |
GO:0007507 | 0.0057 | 4.8897 | 1.166 | 5 | 563 | heart development |
GO:0046668 | 0.0062 | 248.197 | 0.0062 | 1 | 3 | regulation of retinal cell programmed cell death |
GO:0048769 | 0.0062 | 248.197 | 0.0062 | 1 | 3 | sarcomerogenesis |
GO:0060128 | 0.0062 | 248.197 | 0.0062 | 1 | 3 | corticotropin hormone secreting cell differentiation |
GO:0060164 | 0.0062 | 248.197 | 0.0062 | 1 | 3 | regulation of timing of neuron differentiation |
GO:0072011 | 0.0062 | 248.197 | 0.0062 | 1 | 3 | glomerular endothelium development |
GO:1903712 | 0.0062 | 248.197 | 0.0062 | 1 | 3 | cysteine transmembrane transport |
GO:2000546 | 0.0062 | 248.197 | 0.0062 | 1 | 3 | positive regulation of endothelial cell chemotaxis to fibroblast growth factor |
GO:0048812 | 0.0064 | 4.7572 | 1.1971 | 5 | 578 | neuron projection morphogenesis |
GO:0021885 | 0.0064 | 18.2221 | 0.1201 | 2 | 58 | forebrain cell migration |
GO:0022617 | 0.0064 | 18.2221 | 0.1201 | 2 | 58 | extracellular matrix disassembly |
GO:0001763 | 0.0067 | 8.5198 | 0.3873 | 3 | 187 | morphogenesis of a branching structure |
GO:0048858 | 0.0073 | 4.599 | 1.2364 | 5 | 597 | cell projection morphogenesis |
GO:0048589 | 0.0075 | 4.5669 | 1.2447 | 5 | 601 | developmental growth |
GO:0048645 | 0.0075 | 16.7234 | 0.1305 | 2 | 63 | animal organ formation |
GO:0007169 | 0.0075 | 4.559 | 1.2468 | 5 | 602 | transmembrane receptor protein tyrosine kinase signaling pathway |
GO:0060537 | 0.0079 | 5.6 | 0.7973 | 4 | 385 | muscle tissue development |
GO:0055065 | 0.0081 | 4.4734 | 1.2695 | 5 | 613 | metal ion homeostasis |
GO:0002528 | 0.0083 | 165.4545 | 0.0083 | 1 | 4 | regulation of vascular permeability involved in acute inflammatory response |
GO:0018916 | 0.0083 | 165.4545 | 0.0083 | 1 | 4 | nitrobenzene metabolic process |
GO:0021828 | 0.0083 | 165.4545 | 0.0083 | 1 | 4 | gonadotrophin-releasing hormone neuronal migration to the hypothalamus |
GO:0022028 | 0.0083 | 165.4545 | 0.0083 | 1 | 4 | tangential migration from the subventricular zone to the olfactory bulb |
GO:0022614 | 0.0083 | 165.4545 | 0.0083 | 1 | 4 | membrane to membrane docking |
GO:0033600 | 0.0083 | 165.4545 | 0.0083 | 1 | 4 | negative regulation of mammary gland epithelial cell proliferation |
GO:0035481 | 0.0083 | 165.4545 | 0.0083 | 1 | 4 | positive regulation of Notch signaling pathway involved in heart induction |
GO:0060129 | 0.0083 | 165.4545 | 0.0083 | 1 | 4 | thyroid-stimulating hormone-secreting cell differentiation |
GO:0060157 | 0.0083 | 165.4545 | 0.0083 | 1 | 4 | urinary bladder development |
GO:0061737 | 0.0083 | 165.4545 | 0.0083 | 1 | 4 | leukotriene signaling pathway |
GO:0097476 | 0.0083 | 165.4545 | 0.0083 | 1 | 4 | spinal cord motor neuron migration |
GO:2000697 | 0.0083 | 165.4545 | 0.0083 | 1 | 4 | negative regulation of epithelial cell differentiation involved in kidney development |
GO:0050789 | 0.0084 | 3.0863 | 22.2055 | 29 | 10722 | regulation of biological process |
GO:0035924 | 0.0087 | 15.4517 | 0.1408 | 2 | 68 | cellular response to vascular endothelial growth factor stimulus |
GO:0021536 | 0.009 | 15.2201 | 0.1429 | 2 | 69 | diencephalon development |
GO:0072089 | 0.009 | 15.2201 | 0.1429 | 2 | 69 | stem cell proliferation |
GO:0030855 | 0.0091 | 4.3398 | 1.3068 | 5 | 631 | epithelial cell differentiation |
GO:0010975 | 0.0093 | 5.3414 | 0.8346 | 4 | 403 | regulation of neuron projection development |
GO:0009314 | 0.0098 | 5.2602 | 0.847 | 4 | 409 | response to radiation |
GO:0033002 | 0.0098 | 7.3818 | 0.4453 | 3 | 215 | muscle cell proliferation |
GO:0006952 | 0.0098 | 3.0823 | 3.0962 | 8 | 1495 | defense response |
GO:0030198 | 0.01 | 7.37 | 0.4479 | 3 | 229 | extracellular matrix organization |
GOMFID | Pvalue | OddsRatio | ExpCount | Count | Size | Term |
GO:0048731 | 0 | 6.4136 | 5.7106 | 18 | 2912 | system development |
GO:0022008 | 0 | 6.2303 | 2.4692 | 11 | 1203 | neurogenesis |
GO:1903244 | 2e-04 | 129.9365 | 0.0208 | 2 | 9 | positive regulation of cardiac muscle hypertrophy in response to stress |
GO:1905205 | 2e-04 | 113.6875 | 0.0231 | 2 | 10 | positive regulation of connective tissue replacement |
GO:0030182 | 2e-04 | 5.2344 | 2.2199 | 9 | 1092 | neuron differentiation |
GO:0051898 | 2e-04 | 27.9926 | 0.1227 | 3 | 53 | negative regulation of protein kinase B signaling |
GO:0048468 | 3e-04 | 3.8366 | 4.5553 | 13 | 1968 | cell development |
GO:0040011 | 4e-04 | 3.8312 | 4.1039 | 12 | 1773 | locomotion |
GO:0014744 | 5e-04 | 75.7731 | 0.0324 | 2 | 14 | positive regulation of muscle adaptation |
GO:2000026 | 5e-04 | 4.2308 | 2.9744 | 10 | 1285 | regulation of multicellular organismal development |
GO:0045765 | 8e-04 | 7.8539 | 0.7291 | 5 | 315 | regulation of angiogenesis |
GO:0051674 | 8e-04 | 3.7658 | 3.7266 | 11 | 1610 | localization of cell |
GO:0010612 | 8e-04 | 56.816 | 0.0417 | 2 | 18 | regulation of cardiac muscle adaptation |
GO:0034103 | 9e-04 | 17.6854 | 0.1898 | 3 | 82 | regulation of tissue remodeling |
GO:0050767 | 0.001 | 7.2786 | 0.7847 | 5 | 339 | regulation of neurogenesis |
GO:0051093 | 0.0011 | 9.9903 | 0.4583 | 4 | 226 | negative regulation of developmental process |
GO:0008285 | 0.0012 | 4.9687 | 1.6643 | 7 | 719 | negative regulation of cell population proliferation |
GO:0048513 | 0.0013 | 2.9825 | 7.4695 | 16 | 3227 | animal organ development |
GO:0006928 | 0.0014 | 3.3145 | 4.6618 | 12 | 2014 | movement of cell or subcellular component |
GO:0060384 | 0.0015 | 39.5072 | 0.0579 | 2 | 25 | innervation |
GO:1903671 | 0.0016 | 37.8588 | 0.0602 | 2 | 26 | negative regulation of sprouting angiogenesis |
GO:1902547 | 0.0018 | 36.3422 | 0.0625 | 2 | 27 | regulation of cellular response to vascular endothelial growth factor stimulus |
GO:0002526 | 0.0018 | 13.6782 | 0.243 | 3 | 105 | acute inflammatory response |
GO:0009308 | 0.0019 | 13.4135 | 0.2477 | 3 | 107 | amine metabolic process |
GO:0007600 | 0.002 | 4.4796 | 1.8355 | 7 | 793 | sensory perception |
GO:0001662 | 0.0022 | 32.4425 | 0.0694 | 2 | 30 | behavioral fear response |
GO:0048665 | 0.0022 | 32.4425 | 0.0694 | 2 | 30 | neuron fate specification |
GO:0032903 | 0.0023 | Inf | 0.0023 | 1 | 1 | regulation of nerve growth factor production |
GO:0048572 | 0.0023 | Inf | 0.0023 | 1 | 1 | short-day photoperiodism |
GO:0050783 | 0.0023 | Inf | 0.0023 | 1 | 1 | cocaine metabolic process |
GO:0060945 | 0.0023 | Inf | 0.0023 | 1 | 1 | cardiac neuron differentiation |
GO:1902203 | 0.0023 | Inf | 0.0023 | 1 | 1 | negative regulation of hepatocyte growth factor receptor signaling pathway |
GO:1902870 | 0.0023 | Inf | 0.0023 | 1 | 1 | negative regulation of amacrine cell differentiation |
GO:1904445 | 0.0023 | Inf | 0.0023 |